Tag Archives: kinesis money system

Trump 20 could drive global investors to gold both silver and gold prices will benefit from trade wars Heraeus

Trump 2.0 could drive global investors to gold, both silver and gold prices will benefit from trade wars – Heraeus

Trump 2.0 could drive global investors to gold, both silver and gold prices will benefit from trade wars – Heraeus teaser image

The prospect of a Trump victory in November could push investors around the world into the yellow metal, while both gold and silver prices stand to benefit from tariffs and trade disputes, according to precious metals analysts at Heraeus.

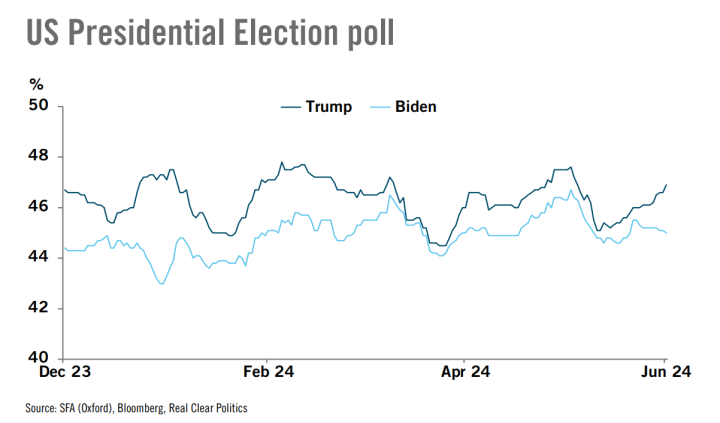
In their latest precious metals report, Heraeus suggested that the economic policies of a second Trump administration could drive global investors into gold. “The upcoming 5 November presidential election will set the United States on two fundamentally different paths, depending on the outcome,” the analysts wrote. “The more unpredictable former president and current Republican candidate, Donald Trump, may introduce several economic policies that could lead to significant market shocks, geopolitical risks and rising inflation. Trump currently maintains an edge over Biden in the polls – 46.9% vs. 45.0%.”

Heraeus pointed out that a renewed trade war could escalate tensions between the U.S. and China and could hurt both the U.S. and global economies.

“While the Biden administration preserved many of Trump’s China tariffs and raised tariffs on only a small basket of Chinese cleantech imports, a second Trump administration could escalate the trade war unprecedentedly,” they said. “Trump has proposed two significant trade policy agendas: imposing a 10% across-the-board tariff on all imports from all countries and imposing tariffs of 60% or more on all Chinese imports. Although the legal feasibility of these measures is still in question, Trump’s first administration demonstrated the possibility of launching a trade war on China by invoking a loophole clause from an old statute – the 1974 Trade Act. A Peterson Institute paper found that these proposed tariffs could lead to an economic loss of 1.8% of US GDP, and significantly raise inflation. This assessment does not account for the almost guaranteed retaliatory tariffs from China and other countries.”

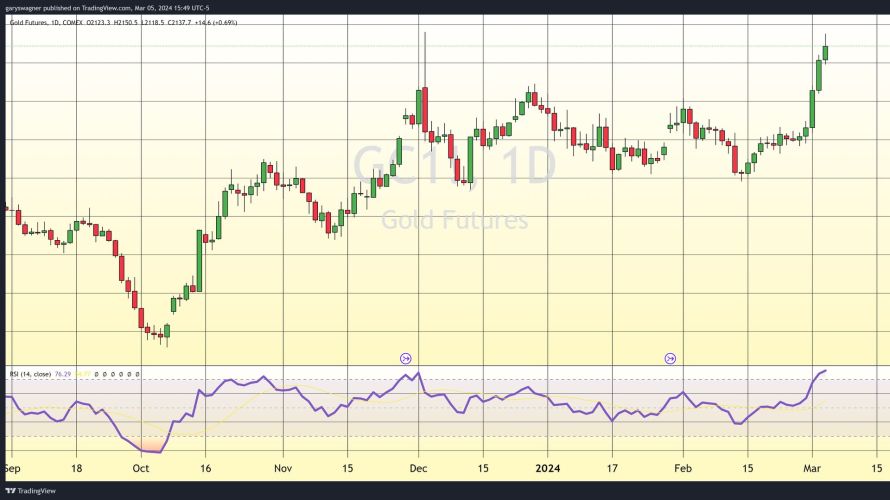
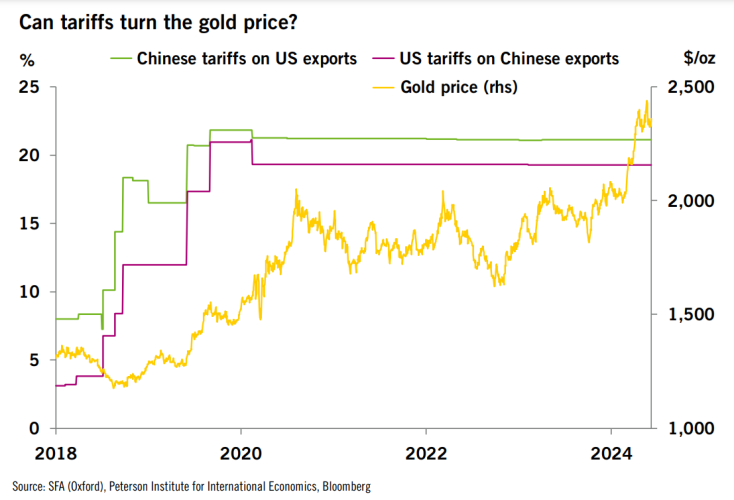
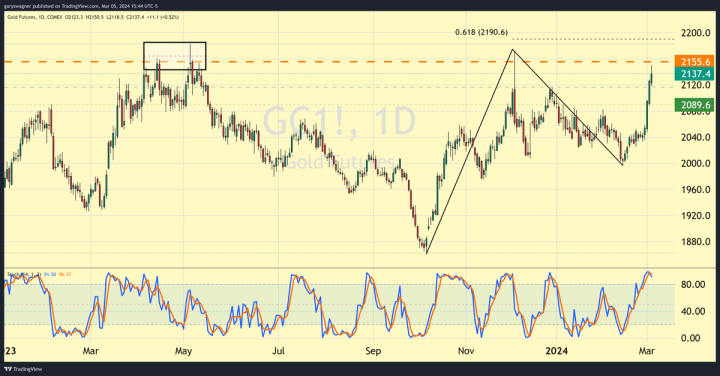
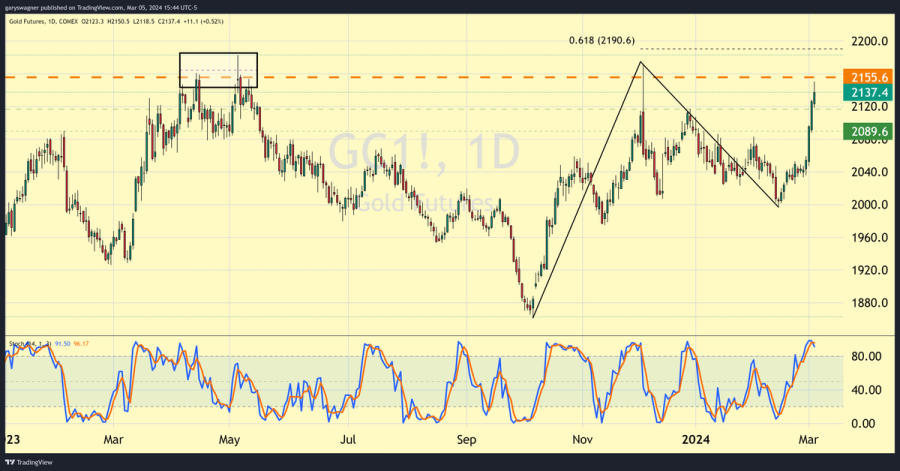
The analysts noted that the 2018-2020 U.S.-China trade war coincided with rising gold prices. “Gold surged during this period as the prolonged negotiations, coupled with tariff and geopolitical escalations, drove investors to seek gold as a safe-haven asset despite a rate-hiking environment until mid-2019,” they said. “Gold’s appreciation closely correlated with the tariff increases which served as a meaningful indicator of US-China tensions (see the chart). Global ETF holdings increased from end-2017’s 71 moz to end-2019’s 86 moz, and US ETF holdings grew from 37 moz to 44 moz.

Heraeus worries that Trump could also undermine the independence of the Federal Reserve, as his first presidency saw public attacks on Fed Chair Jerome Powell’s rate hikes.

“Unofficial proposals from the Trump campaign team include steps to undermine the Fed’s independence and potentially removing Powell prematurely,” they said. “Trump could replace Powell after his term ends in 2026 with a dovish candidate. Additionally, Trump could appoint multiple governors to the Federal Open Market Committee (FOMC) who would favour looser monetary policies.”

“A more dovish FOMC would expedite rate cuts and loosen inflation control, weakening the dollar and increasing investors’ demand for gold,” they pointed out. “Any manoeuvres extending executive authority over the Fed could shake market confidence in US monetary policies, further boosting gold prices.”

Moving to the Asian environment for precious metals, the analysts noted that India continues to see robust demand for gold. “Gold imports to India remained strong in May, reaching ~44.5 tonnes, signalling above-average levels of gold purchasing,” they said. “Although May’s imports were slightly lower than last year’s 58.5 tonnes, which marked a particularly high year for India’s gold consumption, high gold imports around mid-year typically translate to robust jewellery production for festivals in the third quarter.”

The analysts noted that India accounted for 95.5 tonnes of jewellery demand in Q1 of 2024, a 4% annual increase. “This is only half of China’s 184.2 tonnes of consumption in the same period (-6% year-on-year),” they wrote. “India’s jewellery consumption makes up 20% of the world’s total, and it is the second-largest consumer market for gold. Resilient demand year-to-date partly offsets the decrease of jewellery demand in China.”

They also pointed out that India’s central bank has seen a net inflow of 24.1 tonnes of gold in 2024, which already surpasses last year’s total. “The Indian central bank has been the third-largest gold purchaser amongst its peers this year, behind Turkey and China,” they said.

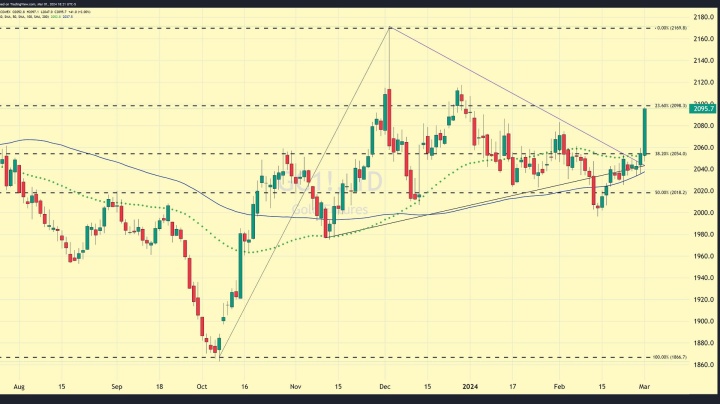
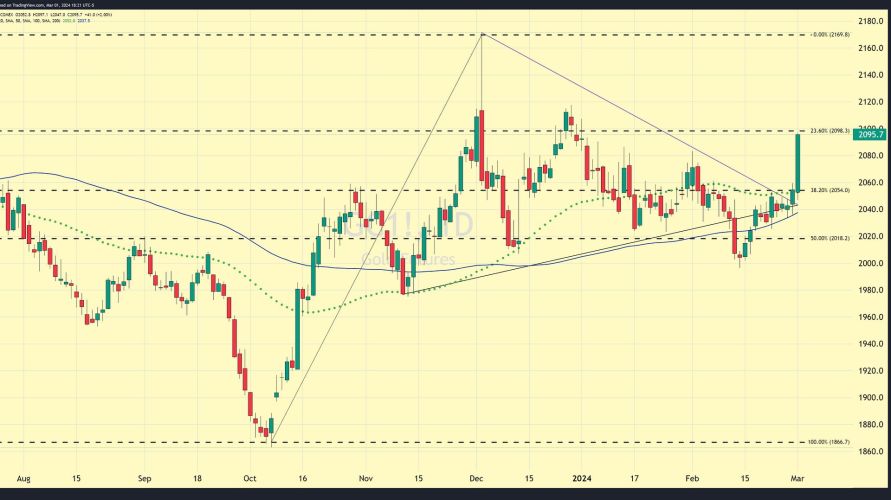
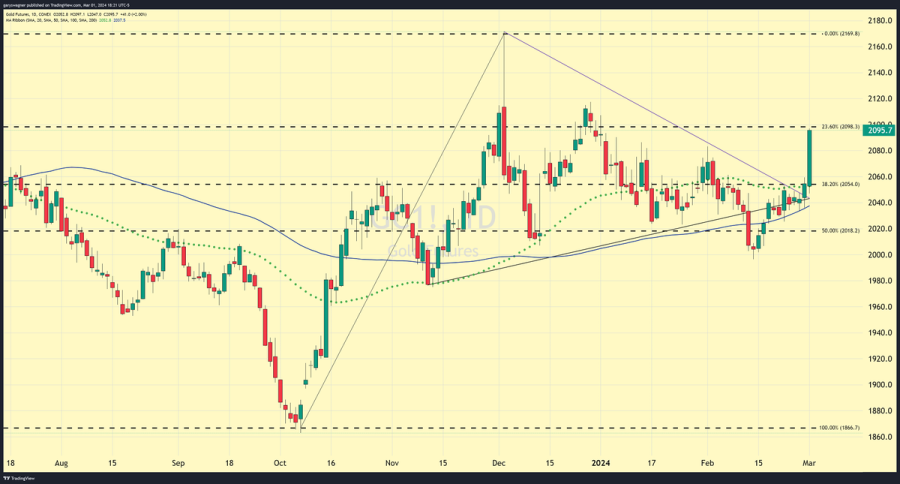
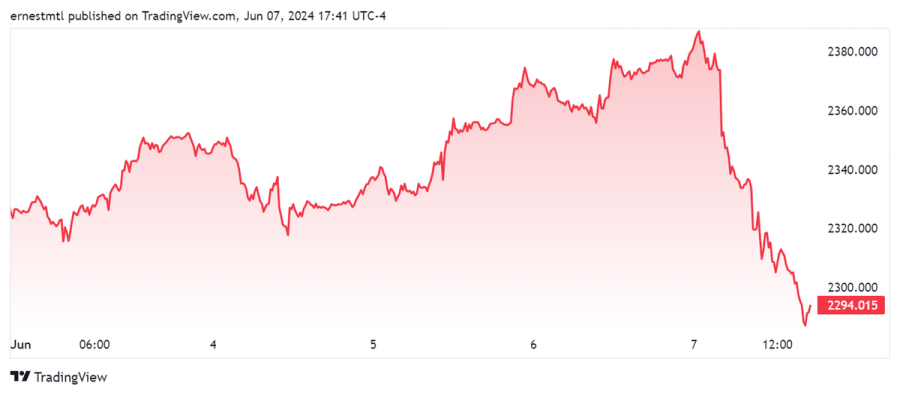
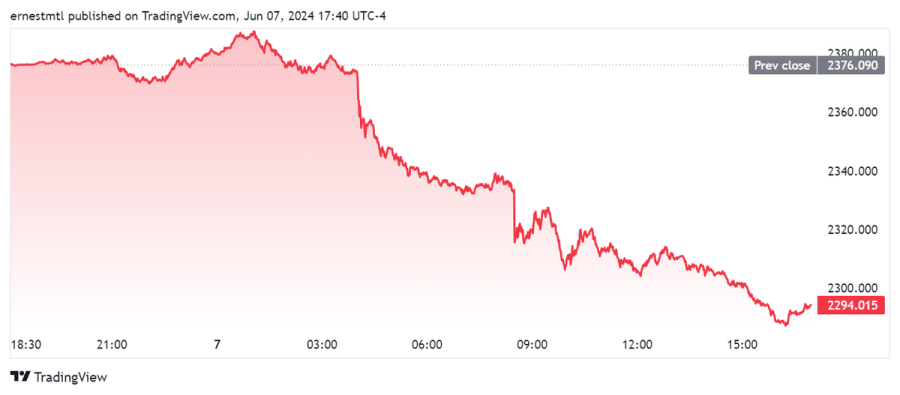
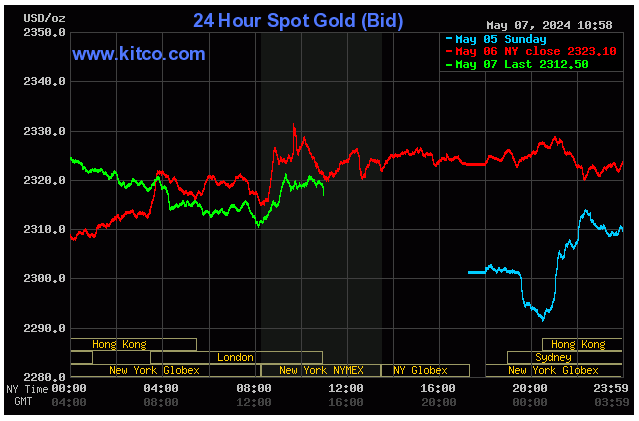
Gold prices remained in their recent channel between $2,300 and $2,340 during the first two days of the week, with spot gold last trading at $2,330.80, essentially flat on the session.

Turning to silver, Heraeus believes the expansion of the U.S. solar manufacturing industry combined with increasing barriers to trade could serve to boost domestic silver demand.

“In Q1’24, the US added 11 GW of new solar module manufacturing capacity, driven by substantial investments spurred by the Inflation Reduction Act,” the analysts noted. “Thanks to rapid solar deployment in every major region, silver demand from solar PVs is expected to reach a consecutive record of more than 230 moz this year (source: The Silver Institute), equal to ~19% of total global use of silver."

And solar is not the only area of silver demand benefiting from the green energy transition, they noted. “Expansion of EV charging infrastructure is also an area of focus for government subsidies in the US,” they said. “Since January 2021, the number of public EV chargers has grown by 55% to ~175,000 across the country (source: Joint Office of Energy and Transportation). The rollout of large-scale electric infrastructure requires the use of silver in connectors and various components.”

“Moreover, the US is expected to announce several tariffs aimed at curbing Chinese circumvention practices, such as evading tariffs by setting up PV manufacturing plants in Southeast Asia,” Heraeus wrote. “These trade barriers could segment the market and put pressure on the US government to expand domestic demand, creating a bullish outlook for silver’s industrial uses.”

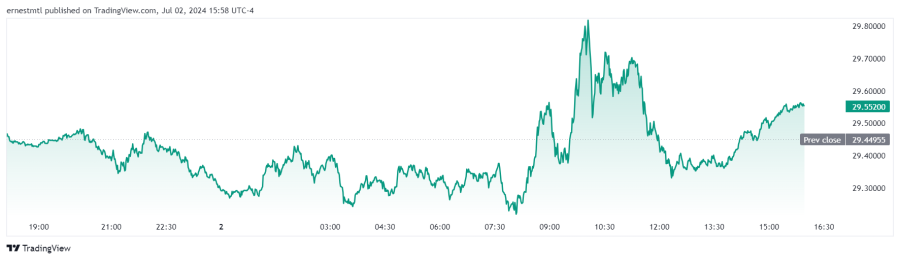
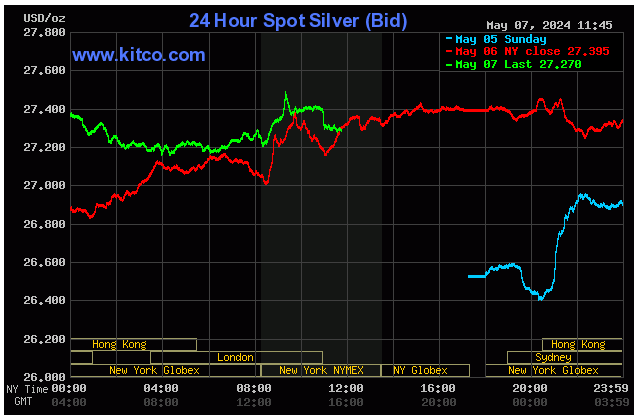
Silver prices have seen mildly positive momentum this week, with spot silver hitting a session high of $29.823 shortly after 10 am EDT on Tuesday, and last trading at $29.552 for a gain of 0.35% on the daily chart.

Kitco Media

Ernest Hoffman

Time to Buy Gold and Silver

Tim Moseley

Wall Street throws in the towel on gold after Friday’s rout Main Street optimism likely a pre-selloff snapshot

Wall Street throws in the towel on gold after Friday’s rout, Main Street optimism likely a pre-selloff snapshot

This week, precious metals markets saved all their drama for the grand finale. Spot gold opened the week trading at $2,325.26, and spent much of the first four days trading in a relatively narrow $25 range.

The expected 25 basis point rate cuts from the ECB and the Bank of Canada came and went, with spot gold eventually setting its weekly high of $2,386.75 just after midnight on Friday.

North American traders went to bed Thursday night expecting Friday morning’s nonfarm payrolls (NFP) report to be the week's highlight for gold. But the People's Bank of China (PBoC) stole the spotlight in the early hours, announcing at 4 am EDT that they had broken their 18 months streak of sovereign gold purchases in May and sending metals prices crashing through multiple levels of support as algorithmic stop loss orders were filled in rapid succession.

Spot gold sank like a stone, falling from $2,373.85 just before 4 am to $2,343.68 only one hour later, with much of the move taking place in a matter of minutes.

Then, the yellow metal was trading at $2,333.42 in the moments before the 8:30 am release of the surprisingly strong U.S. jobs report, which drove gold down even further as markets recognized that the Fed would have even less reason to cut in the near term. As gold was already down over $40 at that point, the NFP took the yellow metal all the way down to support near $2,300 per ounce.

Gold saw multiple bounces off the $2,300 level throughout Friday trading, but finally broke through support shortly after 2:40 pm EDT.

The latest Kitco News Weekly Gold Survey has the majority of industry experts throwing in the towel on gold’s near-term prospects, while most retail traders saw gains for gold in the coming week, though most voted before Friday morning’s fireworks.

“Two forces drove gold to new one-month lows ahead of the weekend,” said Marc Chandler, Managing Director at Bannockburn Global Forex. “The first, and which got the ball rolling, was news that although the dollar value of China’s reserve grew last month, it did not add to its gold holdings for the first time in 18 months. The second, which added insult to injury was the jump in US rates and the dollar in response to the stronger than expected US jobs data.”

“A break of $2300 in the spot market targets the May lows near $2277,” Chandler added. “A break of the $2270 area could send the yellow metal down to the $2220 area.”

“China rugging the gold bulls like GME today,” said Adam Button, head of currency strategy at Forexlive.com. Button thinks gold has further to fall. “This China news is bad,” he added.

Darin Newsom, Senior Market Analyst at Barchart.com, said gold prices are likely to move lower in the days ahead.

“While I’m not reading anything into Friday morning’s spike move, a knee-jerk reaction to the comic relief known as monthly US employment numbers, August gold remains in an intermediate-term downtrend on its weekly chart,” Newsom said. “The contract’s short-term daily chart is also showing a downtrend that didn’t quite complete itself this past week. Much will depend on Friday’s close, though the initial reaction Friday saw August take out its previous 4-day low of $2,334.80. Now we’ll see if there were any sell orders waiting below that mark."

“Positioned in inverse Gold and Silver ETFs as a hedge here, as the market has temporarily turned South,” said Mark Leibovit, publisher of the VR Metals/Resource Letter.

“I’m sticking with up, as support structure is still in place from the weekly chart,” said James Stanley, senior market strategist at Forex.com. “And for the first four days of the week gold held in a fairly strong position until finding resistance at 2378.”

“I think the driver around Chinese gold reserves could possibly be a trap door, and I don’t think the Fed is going to come off as overly hawkish next week,” Stanley added.

Colin Cieszynski, Chief Market Strategist at SIA Wealth Management, was weighing the implications of the jobs report ahead of next week’s Fed rate decision.

“The U.S. employment numbers mean it's less likely that the Fed's going to cut rates,” he said. “It's less likely they'll cut rates next week, and they're really under pressure to not cut rates. And that's been propping up the U.S. dollar, particularly in a week where Canada and Europe did cut rates.”

Cieszynski said this will also have a significant impact on the U. S. dollar, and on gold prices.

“That puts a tailwind behind the U.S. dollar and a headwind in front of gold in the near term, and other commodities as well,” Cieszynski said. “Anything that's priced in U.S. dollars has a headwind in front of it now, because this could boost the U.S. dollar a little bit in the short term.”

Looking past the surprising headline number, Cieszynski said that the most significant thing about the jobs report was its inflation data.

“The most important part was actually that wage inflation is going up again,” Cieszynski said. “I think a lot of people were hoping that maybe the Fed would signal a rate cut in July, but yeah… maybe September. You could still do two rate cuts this year, in September and December, one before the election and one afterwards.”

Cieszynski said that the downward price action from gold could be fairly dramatic, as its run-up provided few obvious areas of support. “It broke out over $2,160, and then it very quickly went to $2400, so the support is in at around $2,280ish, $2,285, and if that gets taken out, then back to $2,125, $2,150.”

This week, 18 Wall Street analysts participated in the Kitco News Gold Survey, and after Friday’s precipitous slide, few were optimistic about the near term. Only two experts, representing 11%, expect to see gold prices climb higher next week. Eleven analysts, fully 61%, predicted a price decline, and the remaining five, or 28% of the total, see gold trending sideways during the coming week.

Meanwhile, 184 votes were cast in Kitco’s online poll, with Main Street investors representing the ‘before’ picture of a relatively optimistic market. 107 retail traders, or 58%, look for gold prices to rise next week, the same proportion as last week. Another 33, or 18%, expected they would be lower, while 44 respondents, representing the remaining 24%, saw prices chopping sideways during the week ahead.

Next week will revolve around the Wednesday morning release of U.S. CPI for May, followed by the Federal Reserve’s monetary policy decision in the afternoon.

Then on Thursday, markets will be watching U.S. PPI for May and weekly jobless claims, with the Bank of Japan set to announce their monetary policy decision in the evening. And Friday morning will see the release of Preliminary University of Michigan Consumer Sentiment.

Adrian Day, President of Adrian Day Asset Management, was among the minority who believe gold could stage a comeback next week.

“Friday’s drop after the U.S. payroll report is overdone, and suggests some holders were nervous weak hands,” Day said. “The concern is that the payrolls report pushes back the prospects of a rate cut by the Federal Reserve, but no-one was expecting it at next week’s meeting; September was the earliest when a Fed rate cut was broadly expected. A lot can happen twixt now and then.”

“Moreover, the U.S. and the Fed are not the only game in town,” he added. “Both the European Central Bank and the Bank of Canada have cut rates in the last weeks, with a few other small central banks. The global trend is definitely to lower rates.”

Day said that while gold might see some follow-through from today’s selloff, he thinks it will only be for a day or two, and only shallow. “By the end of the week, I would expect gold to be moving up again.”

Kevin Grady, president of Phoenix Futures and Options, was looking at the market dynamics on Friday after the sharp overnight selloff.

“When the market dumps like that, the rest of the day is no longer about the news,” he said. “The rest of the day is people hitting stops, and in that market, it gets into a rhythm of the day where people are liquidating. So when you enter a day as a trader, and you see people are liquidating positions, it just changes the day. People are thinking, are there more stops under the market? Did we hit all the stops? Where's the buying coming in?”

“As a trader, that's what I look for,” Grady said. “I remember standing in the trading pit for years and years, and that's what I would watch for. Where are the stops? The market sells off… are they continuing? When you see another dip in the market and it doesn't continue, and strong buying comes in, who's doing that strong buying? Where's it coming from?”

Grady said that the payrolls report just exacerbated an already declining market, but soon all eyes will move to next week’s data.

“Let's see what the CPI looks like,” he said. “I think that's going to be the key for us. We have to wait and see.”

He’s also very interested in what Federal Reserve chair Jerome Powell will say at next week’s post-FOMC press conference.

“No one's anticipating any rate movements, but it's all about the verbiage, and the dot plot,” Grady said. “Everybody wants to know, where do these guys all stand as far as their projections and how many rate cuts are coming in, or will there be [cuts]? You saw the ECB cut rates this week. I still say that inflation is hot. Everything that touches, every single person, food, rent, education, insurance, any of those prices. Inflation is 15 percent at least on most of those metrics and I think that these guys see it.”

Grady said he thinks it’s increasingly likely that the Federal Reserve will decide to bite the bullet and raise the inflation target above 2%.

“I don't know if these guys at some point are going to start raising their target a little higher and say, our number is no longer 2 percent that we're going to target, we're going to try to say maybe it's 3%. I think that discussion is being kicked around, and I think that discussion has to be had, because right now, I don't think it's prudent to cut rates. I just don't think it's warranted, but they're in a really tight spot because on all the servicing debt that they have, they're paying exorbitant interest rates, and especially if the ECB is cutting rates, the entire world is flooding into U.S. Treasuries at 5.2%.”

Grady said that the Fed will need to do something at some point. “We're holding up the world, and we're going to continue to pay an exorbitant amount for our debt to service our economy?” he asked. “That's why I think these guys are in a real pickle.”

“I think they'd like to [cut], but I think the only way they're going to be able to lower rates is if they say, our target’s raised a little, we're going to go to maybe 3%,” Grady concluded.

“Gold's chart looks really weak, which is not surprising,” said Phillip Streible, Head of Market Strategy at Blue Line Futures. “If you are looking for metals exposure, copper and silver have better fundamentals. Gold investors should take a bit of a break for now.”

“We are likely in higher timeframe bearish correction against the move up from 19001,” said Michael Moor, Founder of Moor Analytics. “The trade below 24343 (+1.3 tics per/hour) has brought in $122.3 of pressure. The trade below 24216 (+4 tics per/hour) projects this downward $60 (+)—we have attained $109.6. On 5/22 we left the minor bearish reversal warned about, and on 5/23 left another bearish reversal above. These rolled into the (Q) and are OFF HOLD. Decent trade below 23642 (-1.2 tics per/hour starting at 6:00am) should bring in decent pressure, likely for days.”

“Neutral,” said Naeem Aslam, Chief Investment Officer at Zaye Capital Markets. “Consolidation with a grind to the downside.”

And Kitco Senior Analyst Jim Wyckoff sees further declines for gold next week. “Steady-lower as chart damage inflicted recently,” he said.

Spot gold last traded at $2,294.01 per ounce at the time of writing, down 3.45% on the day and down 1.43% on the week.

Kitco Media

Ernest Hoffman

Time to Buy Gold and Silver

Tim Moseley

Modest downside corrections for gold silver

Modest downside corrections for gold, silver

KGold and silver prices are posting mild losses in subdued midday U.S. trading Tuesday, on corrective pullbacks after Monday’s decent gains. A firmer U.S. dollar index on this day is a mildly bearish “outside-market” force working against the precious metals market bulls. June gold was last down $10.00 at $2,321.30. July silver was last down $0.089 at $27.525.

Risk appetite was not dented much Tuesday, at least not yet, after Israel said it had taken control of part of the southern city of Rafah in the Gaza strip near the Egyptian border. The stepped-up Israeli military operations in Gaza come as there had been better hopes a ceasefire between Israel and Hamas might be imminent.

The key outside markets today see the U.S. dollar index modestly higher. Nymex crude oil prices are near steady and trading around $78.50 a barrel. The yield on the benchmark 10-year U.S. Treasury note is fetching 4.429%.

Technically, June gold futures bulls have the overall near-term technical advantage. A price downtrend is still in place on the daily bar chart, however. Bulls’ next upside price objective is to produce a close above solid resistance at $2,400.00. Bears' next near-term downside price objective is pushing futures prices below solid technical support at $2,250.00. First resistance is seen at this week’s high of $2,341.90 and then at $2,350.00. First support is seen at $2,300.00 and then at last week’s low of $2,285.20. Wyckoff's Market Rating: 6.5.

July silver futures bulls have the overall near-term technical advantage. A price downtrend on the daily bar chart has stalled. Silver bulls' next upside price objective is closing prices above solid technical resistance at $29.00. The next downside price objective for the bears is closing prices below solid support at last week’s low of $26.255. First resistance is seen at today’s high of $27.77 and then at $28.00. Next support is seen at $27.25 and then at $27.00. Wyckoff's Market Rating: 6.0.

July N.Y. copper closed down 45 points at 461.05 cents today. Prices closed near mid-range today. The copper bulls have the solid overall near-term technical advantage. Prices are in a three-month-old uptrend on the daily bar chart. Copper bulls' next upside price objective is pushing and closing prices above solid technical resistance at 480.00 cents. The next downside price objective for the bears is closing prices below solid technical support at 440.00 cents. First resistance is seen at today’s high of 464.50 cents and then at the April high of 469.45 cents. First support is seen at this week’s low of 453.55 cents and then at 450.00 cents. Wyckoff's Market Rating: 7.5.

Kitco Media

Jim Wyckoff

Time to Buy Gold and Silver

Tim Moseley

Gold Price News: Gold Closes in on 2200 an Ounce Level

Gold Price News: Gold Closes in on $2,200 an Ounce Level

Gold prices extended their recent gains on Friday to cap a particularly bullish week in which prices notched up fresh all-time highs.

Prices rallied as high as $2,195 an ounce on Friday, although prices eased back to trade at around $2,180 an ounce later in the day. That compares with around $2,160 an ounce in late deals on Thursday.

Gold hits all-time high – KAU price $/g – from Kinesis Exchange

US unemployment figures released Friday came in at 3.9%, well above market expectations of 3.7%, and this contributed towards expectations that the US Fed will need to cut interest rates in the coming months – a supportive element for precious metals prices.

This followed US Fed Chair Jerome Powell’s comments on Wednesday and Thursday highlighting that US interest rates have likely peaked and that cuts are on the horizon, albeit that the central bank will need to see greater evidence that inflation levels are moving toward the targeted 2% before adjusting rates.

US non-farm payrolls figures released Friday showed a larger than expected increase in jobs in February. This would normally be expected to put downward pressure on gold prices as a safe-haven asset. However, the gold market shrugged off the latest figures, as bullish momentum continued as the markets bet on a more dovish monetary policy emerging from the US Fed before the summer.

In addition, the US dollar continued to slide against other major currencies through the week, providing a lift for dollar-denominated gold.

Looking ahead, Monday is looking light on significant data releases and the markets will be looking ahead to Tuesday’s US monthly inflation figures for further insight into the future path for monetary policy.

Time to Buy Gold and Silver

Tim Moseley

Gold’s shock rally has analysts grasping for explanations

Gold’s shock rally has analysts grasping for explanations

Gold’s surprising rally to new all-time highs has even seasoned industry professionals scratching their heads as to the true cause.

“It is clear that despite the West's disaffection for gold […] demand in China is more than offsetting the shortfall, with monumental volumes flowing from West to the East,” wrote Metals Daily CEO Ross Norman in a LinkedIn post. “As such, this rally seems to have caught Western experts and forecasters by surprise – a stealth rally if you like – which suggests to me the buying is beyond the immediate purview of most of us.”

Norman said the “conventional explanation” is that gold is rallying ahead of an expected rate cut at the June Fed meeting, which would weaken the dollar and strengthen gold, “but the dollar is actually up YTD and silver is not validating the move higher in the complex as evidenced by a decline in the gold/silver ratio as we would have expected.”

Another possible explanation would be the decline in U.S. treasury yields, “down 1.2% in the last month and with gold up nearly 6% … but again no evidence that institutions are behind this as ETF demand remains lacklustre.”

Norman said that there’s no doubt that short covering in the futures market has helped boost the rally, but the move is too big for that to be the main driver, “so something else is at play.”

“A significant part of the answer is of course Chinese buying and not just the traditional 'dama' or Chinese grandmothers – Gen Z investors have joined the fray,” he wrote. “But Chinese premiums are slipping (down from a strong $45 premium to $38) as have Indian premiums (down from $5 discount to a $16 discount) suggesting Asia is behaving in a moderately price-elastic manner and easing back on purchases in the face of price strength.”

Norman said he believes the shock rally is being driven by central bank buying, which continues to be very strong according to the latest January numbers.

“With the US moving beyond simple sanctions and threatening to sequester $300 billion in Russian financial assets (to be sold and paid across to support Ukraine) … some Central Banks … even the non-aligned ones, will be alarmed for fear that they might be in the firing line themselves at some point potentially,” he wrote. “It follows therefore that they might prudently wish to diversify into non-dollar assets.”

James Steel, an analyst at HSBC Holdings PLC, told Bloomberg in a report that the scale of the move is surprising given that there hasn’t been a significant change in rate cut expectations or another clear macroeconomic driver.

“The velocity and the speed were very sudden, very fast,” Steel said. “It didn’t seem to have a smoking gun.”

Ole Hansen, commodity strategist at Saxo Bank, said that the ISM manufacturing PMI data for February released on March 1, which came in well below expectations, highlighted the rising risk of a stock market correction, and may have prompted some investors to move from equities to gold.

TD Securities commodity strategist Ryan McKay believes that macro funds and momentum buying by commodity trading advisors contributed to gold’s sudden gains, with the latest Commodity Futures Trading Commission data showing hedge funds and money managers increasing their net bullish gold bets as of Feb. 27. Still, McKay noted that these investors added short positions roughly in line with new longs, meaning they’re not all in on gold’s upward move either.

The report noted that gold’s recent rally has also highlighted the growing disconnect between spot prices and gold-backed ETF outflows. “Holdings in SPDR Gold Shares, the world’s largest such ETF, fell by 0.3 per cent on March 4, taking the total to the lowest level since July 2019, according to data compiled by Bloomberg,” they wrote. “Those outflows have partly been offset by persistent central bank demand for the precious metal, which helped keep prices elevated even as real interest rates spiked last year.”

They also pointed out that physical demand for gold bars and coins also absorbed the gold that was sold by ETFs, and a strong Lunar New Year saw Chinese consumers buying gold as a hedge against the country’s beleaguered stock markets and real estate sector.

Ewa Manthey, commodities strategist at ING, believes the rally is being driven by a combination of rate cut expectations and geopolitical turmoil. “Speculation over a Fed rates pivot and continued geopolitical tensions keep gold shining,” said Manthey. “We expect gold prices to trade higher this year as safe-haven demand continues to be supportive amid geopolitical uncertainty with ongoing wars and the upcoming U.S. election.”

Spot gold hit a high of $2,150 per ounce around noon EST as Fed Chair Jerome Powell presented the central bank’s semiannual Monetary Policy Report to the U.S. House Financial Services Committee. It last traded at $2,148.90, up 0.84% on the day at the time of writing.

Kitco Media

Ernest Hoffman

Time to Buy Gold and Silver

Tim Moseley

Gold continues to rise but technical studies suggest gold is overbought

Gold continues to rise, but technical studies suggest gold is overbought

Gold continues its dynamic rally moving to higher ground for the fourth consecutive day, with the last three consecutive days resulting in a new record settlement price. As of 4:00 PM ET, gold futures basis the most active April contract is currently trading up $11.70 and fixed at $2138.20. However, today gold futures are trading well off of $2150.50 its intraday high, the first occasion in the last few days in which gold has not closed near or at its daily high.

The current rally became dynamically stronger last Friday, March 1st when gold futures opened just at its 50-day simple moving average and gained $41 in trading. The $41 gain occurred after a report by the Institute for Supply Management which revealed its manufacturing index dropped to 47.8 in February, “signifying an economic contraction.” This is according to Ryan McIntyre, managing partner at Sprott Asset Management.

Follow-through buying was evident yesterday with gold futures scoring over a $30 gain taking the precious yellow metal to $2126.30.

However, this latest rally is not broad-based but rather fueled by a “jump in speculative betting”, according to Adrian Ash, director of research at BullionVault. Speaking to MarketWatch he said there is “no gold rush among Western investors right now, not in physical bullion and not outside Comex futures and options.”

Ash added that “gold exchange-traded funds continue to “shrink to pre-pandemic size; coin shops are slashing their premiums and buy-back prices to try clearing the flood of customer selling.”

The current rally is fueled largely by overwhelming optimism that the Federal Reserve will begin its pivot from interest rate hikes to its first interest rate cut since March 2022. However, this optimism is not in-line with recent comments of multiple Federal Reserve members including Chairman Powell. Fed officials continue to express the narrative that “they are in no rush to cut rates”.

Investors are hoping to gain more insight when Chairman Powell heads to Capitol Hill for his semi-annual testimony to the House and Senate beginning tomorrow. According to the CME’s FedWatch tool, there is a 97% probability that the Federal Reserve will not begin to cut rates at their March FOMC meeting and a 79.1% probability that the Fed’s benchmark Fed funds rate will remain unchanged at the May meeting.

However, this probability indicator dramatically favors a rate cut by June with only a 27.2% probability that they will not cut rates in June.

That being said, there are technical indicators that suggest that the recent rise in gold prices has put the precious yellow metal in an overbought situation. The chart above is a daily Japanese candlestick chart of gold with a stochastic oscillator. This study indicates that gold is very much overbought well over 80%, with the %K line crossing below the %D line which signals a strong potential for gold prices to decline. According to Investopedia, “ Stochastic oscillator charting generally consists of two lines: one reflecting the actual value of the oscillator for each session, and one reflecting its three-day simple moving average. Because price is thought to follow momentum, the intersection of these two lines is considered to be a signal that a reversal may be in the works, as it indicates a large shift in momentum from day to day.”

The chart above is also a daily Japanese candlestick chart with the RSI (Relative Strength Index) at 76.23. The RSI is a momentum indicator that measures the speed and magnitude of recent price changes used to evaluate if the market is over or undervalued. The RSI has moved above 70 indicating that gold is overbought and also suggests that gold could be primed for a trend reversal or a technical price pullback according to Investopedia.

While both of these technical studies strongly indicate that gold is overbought, the caveat to these momentum indicators is that gold could continue to rise and continue to be overbought. However, the fact that both of these indicators suggest that gold is extremely overbought warrants our attention as a potential indication that gold could pivot from its current bullish demeanor and signal imminent price correction.

Wishing you as always good trading,

Kitco Media

Gary Wagner

Time to Buy Gold and Silver

Tim Moseley

Gold price above 2100 the market is just getting started – Jess Felder

Gold price above $2,100, the market is just getting started – Jess Felder

The gold market is seeing solid follow-through buying activity following last week’s record closing price. The precious metal has pushed above $2,100 an ounce, and according to one market analyst, it has room to run.

In an interview with Kitco News, Jess Felder, founder of the Felder Report, said he has been looking for gold to break to the upside as the price action has generated some very bullish technical patterns.

“Gold is forming consistent bullish flag patterns. The price spikes higher, consolidates for a period and then we see another price spike higher. Gold has been looking to break higher for a while now. From a purely technical standpoint, it looks to me like there's a projected target of a couple hundred dollars higher for gold in the short term, but longer term, we're looking at $2,700, $2800, perhaps over the next year or two. Technically, gold just looks very, very good.”


Along with gold’s technical outlook, Felder said that the precious metal has a robust fundamental outlook as he does not expect the Federal Reserve will be able to bring inflation down to its 2% target.

He added that persistently higher inflation could cause investors to lose faith in the U.S. central bank, weakening the U.S. dollar and making gold an attractive asset. At the same time, Fleder said that a weakening economy will force the Federal Reserve to at least reintroduce quantitative easing as it maintains its restrictive monetary policy.

“If you had both of those things at the same time, that would be the ultimate bull case for gold,” he said. “If it turns out the Fed hasn't done enough to sustainably bring inflation back down, that's going to worry people that way. The whole soft landing narrative is based on the idea that inflation comes down so the Fed can lower rates without a recession. But if inflation doesn't come down and they can't lower rates, that will impact the economy.”

At the same time, Felder noted that credit conditions within global financial markets continue to deteriorate. He added that sooner or later, the Federal Reserve is going to have to pump more liquidity into the market.

As good as gold looks, miners look even better

It’s not just the precious metal that looks good. Felder said that he is extremely bullish on precious metals miners as this sector hasn’t been this beat up since the bear market lows in 2015

However, Felder pointed out that the negative sentiment is not aligned with the sector’s solid fundamentals

“To me, this is a very powerful sentiment signal; it suggests that this is about as bearish as investors can get,” he said. “It’s the ultimate irony: miners are trading as if gold is in a major bear market, but gold is holding near record highs.”

As to what will entice investors back into the mining space, Felder said that he expects a rally in gold to create a lot of new interest. At the same time, he said that a correction in the broader equity market could push some funds into miners.

“There are interesting dynamics in the markets right now. Investors are avoiding commodities, generally, because they're worried that if a recession hits, demand for commodities is going to tank. However, they're obviously not avoiding equities. Personally, I would be more worried about equities because corporate profits in a recession fall a lot faster than demand for commodities.”

As to where he sees value in the sector, Felder said that with higher gold prices, major producers like Barrick, Newmont, and Agnico Eagle will benefit from increased cash flows. He added that these companies also represent less risks for generalist investors.

Newmont, the world’s largest gold producer, has recently attracted particular attention after its share price dropped to a five-year low. The company’s share price has since bounced off those lows, currently trading at $32.91 per share.

“Senior producers are about as dirt cheap as they can get,” he said.


Kitco Media

Neils Christensen

Time to Buy Gold and Silver

Tim Moseley

Gold bears are hibernating this week as the market sees record closing price

Gold bears are hibernating this week as the market sees record closing price

A record weekly close for gold is fueling significant bullish sentiment in the marketplace; however, some analysts have said that this breakout still needs to be tested, and investors should be careful about chasing prices.

Results of the Kitco News Weekly Gold Survey show that both Wall Street analysts and retail investors are cautiously optimistic about gold next week.

Gold prices managed to push above $2,050 an ounce Thursday after The Federal Reserve’s preferred inflation gauge showed a benign rise in consumer prices. After a slow start Friday, the precious metal started to attract some followthrough buying momentum following weaker-than-expected manufacturing and sentiment data.

April gold futures last traded at $2,095.20 an ounce, up 2% from last week. The precious metal’s best performance since late November has created a new record closing price.

While the rally has breathed new life into the precious metals market, some analysts have said that the price action remains sensitive as profit-taking and volatility could push prices back to within their well-defined channel.

Adam Button, chief currency strategist at Forexlive.com, said that Friday’s rally shows how much potential gold has; however, he added that he doesn’t see the rally as being backed by strong fundamentals.

“I just don’t see how a miss in ISM manufacturing could drive prices this high. I would be more convinced this rally was sustainable if it came after really disappointing employment numbers,” he said. “I think investors do need to pay attention because this shows how many investors are waiting for the dollar to crack before jumping into the market.”

James Stanley, senior market strategist at Forex.com, said that he is also not chasing the market, even as he anticipates higher prices in the near-term.

“I don’t think the pivot at the Fed is here yet. And while I have been very bullish on gold the past few weeks, even after the 2k test, spot [prices] trading over $2,075 is something I don’t want to chase here. That was the level that caught the high in 2020 and has remained a significant roadblock for bulls in the three and a half years since,” he said. “The NFP report is going to be a big deal for macro next week, but that’s not until Friday, so there could be some testing around $2100, but I’m not optimistic enough on drive beyond that level to chase the move while near that long-term resistance.”

This week, 14 analysts participated in the Kitco News Gold Survey and not one is bearish on gold in the near term. The survey showed 11 analysts, or 79%, were bullish on gold. At the same time, three analysts, or 21%, were neutral on the precious metal.

Meanwhile, Main Street investor sentiment continues to improve steadily. This week, 175 votes were cast in Kitco’s online survey. In a slight improvement from last week, 77 retail investors,representing 44%, looked for gold to rise next week. Another 43, or 25%, predicted it would be lower, while 55 respondents, or 31%, were neutral on the near-term prospects for the precious metal.

Marc Chandler, Managing Director at Bannockburn Global Forex, said $2,088 could represent a major resistance point for gold next week.

“Beyond that is the record high set on that spike in early December to $2135.60. I think we will see a need for the dollar’s resilience to buckle, and that may take greater confidence in a near-term Fed cut. Some Wall Street economists have begun giving up on a cut, and former Treasury Secretary Summers has cautioned that the next move may still be a hike,” he said.

Phillip Strieble, chief market strategist at Blue Line Futures, said that while gold’s rally is impressive, he would like to see gold hold higher support to confirm that this isn’t another bull trap.

Some analysts have said that while gold is seeing an impressive rally, it faces significant resistance at $2,100 an ounce.

Sean Lusk, co-director of commercial hedging at Walsh Trading, said that he sees potential for gold to go higher but remains hesitant to chase the market.

“We have been consolidating for a while now, so this could have some teeth to it,” he said.

Lusk added that investors could look at options to get some exposure to gold and take advantage of the market's momentum. He added that a medium-term play would be to buy $2,100 August gold calls and sell $2,275 February gold puts.

“A modest 5% rally takes the market to $2,175,” he said. “Should August 2100 call trade $70 in the money, we could collect $5K to $6K per spread upon exit, in my opinion.”

Kitco Media

Neils Christensen

Time to Buy Gold and Silver

Tim Moseley

Gold market sees new record closing price but the major test is next week

Gold market sees new record closing price, but the major test is next week

With gold prices pushing to within striking distance of $2,100 an ounce, seeing a new record settlement Friday, the market is setting itself up for a major week ahead, one filled with significant macroeconomic risks.

April gold futures settled Friday at $2,095.70 an ounce, a record close for the precious metal and up more than 2% from last week. The rally started Thursday as prices pushed above initial resistance above $2,050 an ounce after the Federal Reserve’s preferred inflation gauge showed a benign rise in consumer prices.

The gold market is seeing its best weekly gains since November

Meanwhile, silver managed to end the week with a 1% gain, with prices back above $23 an ounce. Although silver continues to underperform gold, some analysts have said it remains an attractive value play in a bull market.

Despite a slow start, disappointing economic data on Friday created some weakness in the U.S. dollar, giving gold and silver room to move quickly to the upside.

“Thursday's and Friday's gains reaffirm gold's ability to rise above its 50-day moving average, which it failed to do a month ago,” said Alex Kuptsikevich, senior market analyst at FxPro.

While gold has managed to break above resistance at $2,050, Kuptsikevich added that the next major resistance level to watch is $2,088. At the same time, the market can see significant upside if the momentum lasts.

“There is an even longer-term scenario. The pullback from the beginning of the year to mid-February is a classic Fibonacci retracement of 61.8% of the first growth impulse from the October lows. The realization of this scenario will be the advance to $2255,” he said.

However, not all analysts are convinced that gold is headed higher, even as it ends the week with significant momentum. In a note Thursday, Nicky Shiels, head of metals strategy at MKS PAMP, noted that gold’s outside move could be the result of its months-long consolidation. She said that momentum can push gold prices higher, but the fundamental picture remains the same, for now.

“With positioning in gold and silver running neutral & short, respectively, technically compressed price action and overall sentiment in precious metals burnt out, it really was a recipe for unexplained outsized moves. Was the PCE a game-changer? No, and not enough data to declare disinflation is about to end, and the Fed may just never cut,” she said in her note. “Can technical rallies extend? Sure. But this is not a catalyst to rope in fresh investor interest, and physical alone doesn’t chase, so it’ll come down to paper shorts and cues provided by macro. Overall, Gold remains bid-to-higher.”

Market analysts at CPM Group are also not optimistic that the gold market can hold Friday’s gains as it is caught in a well-defined trading pattern.

“Gold prices have sold off most every time they have tested resistance levels, and as prices test strong support levels, investors step back into the market, initiating new longs once more. This has kept gold prices in a wide range, mostly above $2,000,” the analysts said in a note late Friday.

“Gold prices are now testing $2,100, having firmly broken above $2,050 yesterday. The market appears to be looking for reasons to go long gold, and taking profits as technical resistance levels are tested,” the analysts added. “It is unclear if prices will continue to climb in the near term, but they already have made strong gains, suggesting the potential for a short-term pullback on profit taking. A retrenchment in prices could push gold back toward $2,075, which could potentially present a buying opportunity should the upward momentum continue.”

Some analysts have noted that gold could face a significant test next week with the release of February’s nonfarm payrolls report. At the same time, markets will be anxious to hear what Federal Reserve Chair Jerome Powell will say in his two days of testimony before Congress.

Adam Button, chief currency strategist at Forexlive.com, said that he will probably be paying more attention to labor market data next week as that could have more impact on the U.S. dollar.

He said weak labor market data could impact the U.S. dollar more than Powell’s comments.

“We basically know what Powell is going to say: interest rates will be coming down, but not anytime soon,” he said. “He will probably also say that the Federal Reserve will continue to monitor incoming data. Weak job growth could sustain gold’s rally.”

It’s not just U.S. economic data that could impact the U.S. dollar. The European Central Bank will meet to decide its monetary policy next week and a hawkish stance could support the euro in the near term.

Commodity analysts at Brown Brothers Harriman said they expect the ECB to strike a cautious tone next week as Europe’s latest inflation data came in hotter than expected.

Economic data to watch next week:

Tuesday: ISM services PMI

Wednesday: ADP employment data, Bank of Canada monetary policy decision, Powell’s testimony before the House Financial Services Committee, JOLTS job openings

Thursday; European Central Bank monetary policy meeting, weekly jobless claims; Powell’s testimony before Senate Banking Committee

Friday: Nonfarm payrolls report
 

Kitco Media

Neils Christensen

Time to Buy Gold and Silver

Tim Moseley

Gold futures bullish sentiment result in the largest daily gain since October 2023

Gold futures bullish sentiment result in the largest daily gain since October 2023

Gold futures bullish sentiment result in the largest daily gain since October 2023 teaser image

Exceptional, phenomenal, amazing, surprising, astounding, and almost beyond belief are only a few of the many words that can be used to describe today’s exceedingly strong upside breakout in gold futures. Gold opened today at $2052.82 and by the close of Globex at 5:00 PM ET gold futures are up $41. At the close, the most active April gold futures contract is trading at $2095.70, a 2% daily gain.

Now that gold futures have concluded for the week and the first trading day of March, the only regular break to gold’s 24-hour trading day (excluding holidays) market participants, investors, and traders are all beginning to have a more comprehensive understanding and explanation as to why gold moved 2% in a single day. The difficulty here is that there was no unexpected fundamental report or event that led to such a tremendous price gain in a single day.

There was no single news event, expected data report, or even a black swan event (an unpredictable or unforeseen event, typically one with extreme consequences) that could simply answer this question. What we do know is this large of a move does not occur frequently.

Today’s gains were the largest daily gain since Friday, October 13. On that day gold futures opened at $1921.70 and closed at $1983.80 and gained approximately $62 in a single day.

So what we must assume is there is a high probability that today’s spike was caused by events that occurred recently that are just beginning to get digested and interpreted in a new light or different way. The one big similarity to last week’s trading range is that Friday’s gain contained the vast majority of the weekly gain. On a weekly basis, gold gained $46.30 which is a 2.26% gain on the week, of which 2% of that gain occurred today. Last week gold gained $25.30 which is a 1.25% gain on the week, of which $18.70 or 92.1% of the gain occurred last Friday, February 23.

However, that fact delivers very little insight if any at all as to why gold had the single largest daily gain in the last five months.

The chart above is a five-minute Japanese candlestick chart of April gold futures. The first blue arrow on the left marks the beginning of the trading day with gold opening at $2052.82. Approximately 3 ½ hours later gold would trade to its low of approximately $2047 and begin the first leg of two rallies that would take gold dramatically higher. Gold would trade from $2047 up to $2066 in just over two hours before trading to another low of $2051, which was above the daily low and was a precursor to the dramatic second leg of the rally which took gold from $2051 to its high above $2096 before trading sideways are consolidating and currently at $2091.60 its settlement price for the week.

The next chart we want to look at is a five-minute candlestick chart of the dollar index which traded to a high today of 104.324, a low of 103.859, and settled down 0.24% at 103.904. The dollar traded with some volatility today, compared to what was witnessed in gold futures.

The chart above is a daily candlestick chart of gold which shows the incredibly large and dynamic price spike in one single candlestick which more than anything else clearly illustrates the importance and magnitude of today’s single move. All we can say is that most likely it was a combination of many events in which market sentiment shifted. The first and most obvious one to look at would be a renewed belief that the Federal Reserve will cut rates sooner than expected.

This could stem from the latest inflation report coming in close to the anticipated target. But luckily we have the weekend to aggressively analyze and dissect today’s rally so that on Monday we can bring you a more concise attempted understanding of today’s move.

Kitco Media

Gary Wagner

Time to Buy Gold and Silver

Tim Moseley