Wall Street evenly divided between bulls, bears, and the fence, Main Street cooler on gold’s potential gains
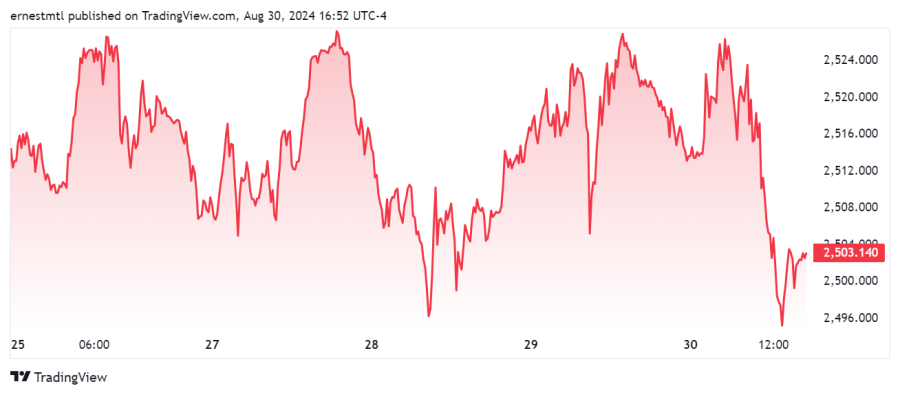
After a series of dramatic performances throughout the summer, gold traders were treated to a relatively calm and steady week as, with the exception of a couple of dips, the precious metal traded within a $25 range above $2,500 per ounce.
Spot gold kicked off the week trading just above $2,514 per ounce before rising to $2,525 during the European trading session on Monday. The North American open saw the yellow metal driven down to $2512 by 11:15 am EDT, and by early Tuesday morning, spot gold had fallen to the then-weekly low of $2,505 per ounce. This time, the North American trading session provided the upward momentum, helping to propel gold prices to their weekly high above $2,525 per ounce shortly after 7:00 pm EDT before the Asian session delivered a perfect reverse image of the day's gains.
Wednesday morning saw spot gold hit its weekly low of $2,496 before it once again bounced back up to the $2,505 range, which acted as a magnet for gold's price action throughout the week. From there, gold prices went on an upward march, topping out above $2,523 per ounce by 6:00 am Eastern on Thursday before a sharp sell-off coinciding with the release of the second estimate of U.S. Q2 GDP and the weekly jobless claims report saw it once again return to the $2,505 level at 8:30 a.m. But by 1:00 p.m. Eastern, gold was once again trading at its weekly high close to $2,527 per ounce, and after a modest slide during the Asian session, European traders pushed it close to that level once again.
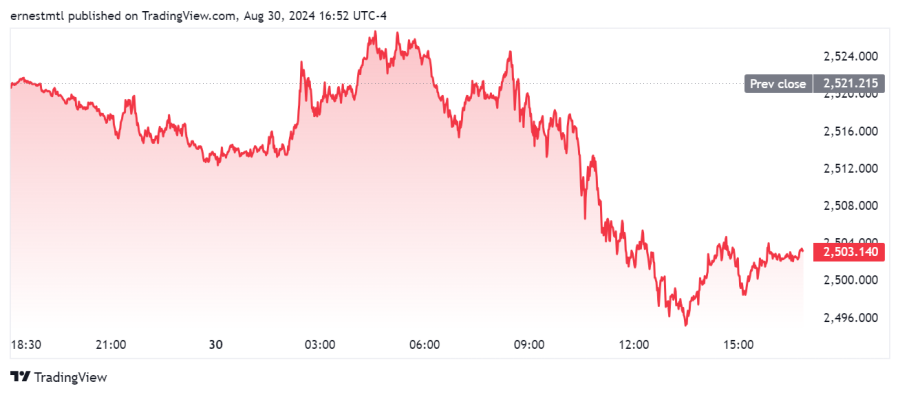
Friday morning brought the week’s most anticipated economic indicator, the U.S. PCE price index report for July which, even though it was in line with economists’ expectations, still saw the yellow metal slide all the way down to a fresh weekly low of $2,494.21 per ounce just after 1:15 pm Eastern.
Gold prices returned once again to the $2,505 level and continued to hover right around support at $2,500 per ounce for the duration of Friday's trading session.
The latest Kitco News Weekly Gold Survey saw retail investors reining in their recent bullishness on gold prices, while industry experts were evenly distributed across the sentiment spectrum.
“Up,” said Adrian Day, President of Adrian Day Asset Management. “As we get close to the Federal Reserve’s rate cut, momentum will likely build. The first rate cut in the cycle has been a bullish signal for gold for the last 20+ years, and although it’s already priced in to some degree, I still expect a positive reaction.”
“I like gold lower next week,” said Marc Chandler, Managing Director at Bannockburn Global Forex. “The upward momentum stalled. If the markets move to hurt most of the people most of the time, maybe the pain trade now is a sequential improvement in US jobs creation and a tick lower in the unemployment rate. This could extend the dollar’s upside correction that began in recent days and push up US rates. I can envision a move toward $2470-75.”
“Sideways,” said Darin Newsom, Senior Market Analyst at Barchart.com. “I’m getting no clear read on Dec gold’s daily chart as we approach the end of the week/month Friday. Given that, I’m going to go with a sideways trend next week, looking for a breakout in either direction.”
Phillip Streible, Head of Market Strategy at Blue Line Futures, is bearish on gold but said that any corrections are expected to be shallow and present buying opportunities. He added that September is a terrible month for gold historically, so traders should look for opportunities to buy, but don't want to be overweight.
Bob Haberkorn, Senior Commodities Broker at RJO Futures, was looking at the price action in light of the sideways churn this week.
“$2,500 is the handle, and it's naturally going to be a spot that people will trade around,” he said. “People are looking to buy below $2,500, and the way the market moves with stops and limit orders, it'll naturally trade around there, but I think $2,480 looks to be more of a support level.”
“We're down today just because the dollar's up, it's risk-off heading into the long weekend,” he added. “That's how it feels with all these markets today, there's just people clearing positions out of anything to wait and see into next week.”
Looking ahead to next Friday’s employment data, Haberkorn said even if the nonfarm payrolls report is bad, he thinks it's very unlikely that the Fed would cut by 50 basis points to kick off their easing cycle.
“I think right now there's just so much pressure that's built up for rate cuts, Powell tipped his hand that it's coming here, and the market's not going to be surprised,” he said. “But I think to get a 50-basis point cut… I don't think we're there, and I don't think, with the inflation numbers and with some of the housing numbers that we've seen, I just don't think it's going to be possible between now and the next meeting to do 50.”
Haberkorn said the most likely scenario he sees is that the Fed delivers one 25 bps cut, then sits back and watches. “I think we're more likely to see a quarter, then they hold off a little bit to see how things go,” he said, “Inflation is still here, people are still feeling the pain of inflation, and I don't think the job's finished.”
“They have 25 points coming at the next meeting,” he said. “If it wasn't an election year, I think they'd be waiting to see, but because we have an election coming up here, and there is a lot of political pressure right now to start cutting rates, I could see them doing two quarter-point cuts between now and November.”
“The quarter-point cut in itself is just the Fed throwing out some charity,” he added. “‘We'll give you a quarter, leave us alone for a little bit.’ That's what it feels like to me, because I don't think they're anywhere near to their targets, or where they need the numbers to be with the inflation, to do anything drastic.”
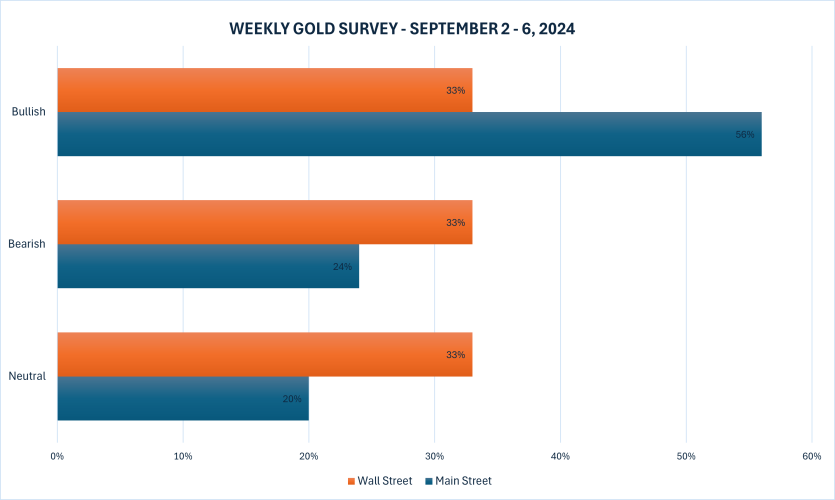
This week, 15 analysts participated in the Kitco News Gold Survey, and no one view on the price action held sway. Five experts, or 33%, expect to see gold prices rise during the week ahead, while another five analysts believe gold will trade lower next week. The remaining five experts predicted sideways trading for the precious metal.
Meanwhile, 199 votes were cast in Kitco’s online poll, with Main Street investors remaining bullish on balance, but less so than last week’s poll. 112 retail traders, or 56%, looked for gold prices to rise next week. Another 47, or 24%, expected the yellow metal to trade lower, while 40 respondents, representing the remaining 20%, saw prices consolidating during the week ahead.
After the past week was dominated by the runup to Friday’s inflation data, market participants will be focused on employment indicators next week when North American markets return from the long weekend.
On Tuesday, markets will receive the U.S. ISM Manufacturing PMI for August, and Wednesday brings the Bank of Canada’s monetary policy decision and U.S. JOLTS Job Openings. Then on Thursday, traders will be watching ADP Employment for August, the weekly jobless claims report, and the U.S. ISM Services PMI.
But the big risk event next week is the Friday morning release of U.S. Nonfarm Payrolls for August, which some market experts believe has the potential to bump the Fed’s expected September rate cut from 25 to 50 basis points.
Adam Button, head of currency strategy at Forexlive.com, believes the chances of a larger cut from the Federal Reserve will depend on the unemployment rate in the payrolls report.
“Powell was clear that he doesn't want to see any further deterioration in the labor market,” he said. “If we see the unemployment rate tick up one tick, it'll make it a tough call. The consensus is down to 4.2% from 4.3%. If we were to see a two-tenths miss, if we were to see 4.4% or 4.5% unemployment… you’ve just got to go back to March and you're at 3.8%, now you're at 4.3%. It's come up quick.”
“At 4.5%, I’d put it at 60 percent [chance] for 50 basis points,” he added. “I think the unemployment rate is where you want to watch.”
On the question of whether a September rate cut would be a one-off followed by a pause, or the start of a steady easing cycle, Button said he believes it’s the latter.
“I think Powell was clear that the plan is to bring rates down to neutral and it's really a question of how quickly we get there,” he said. “Given the signaling, I don't see how [the Fed] could take October off the table.”
Button agreed that Powell wouldn’t stubbornly hold off on signaling rate cuts meeting after meeting, then finally say they’re ready to ease at the highest-profile speech outside of an FOMC meeting, only to deliver a one-off rate cut.
“Also, you had other Fed officials saying ‘gradual’ or ‘measured’ or something along those lines,” he added. “He didn't say that. I think the key thing was what he didn't say. He didn't say gradual or measured. And then, to top it off, you had Daly, previously she had said ‘gradual’, and then she got teed up to say it again and didn't. She's a bit of a mouthpiece for Powell.”
“And that's it. They want 50 on the table,” he said. “You don't put 50 on the table if you're not planning to do 25.”
Turning to the price action for gold, Button said September’s seasonal weakness could provide fence-sitters with a good entry opportunity.
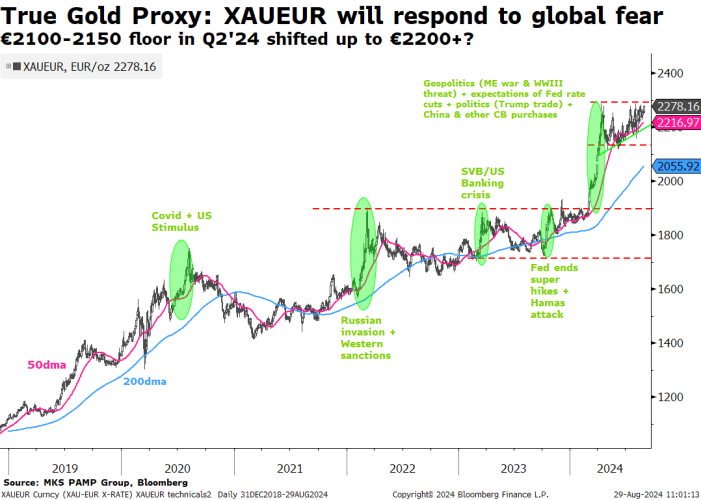
“I'm just waiting for a dip,” he said. “I don't think anyone's fooling themselves that we're going to see $2,000 again, $2,000 is a dream. $2,300 is maybe realistic.”
“$200 was about the dip you got last year,” he added. “It was more like $300 if you really go tip to top, but it unfolded a little more slowly. I think that's probably the best you can hope for, $2,300, and an outside chance you get back to $2,100. I'd be pretty aggressive if it gets to $2,300. And for next week, something like $2,440.”
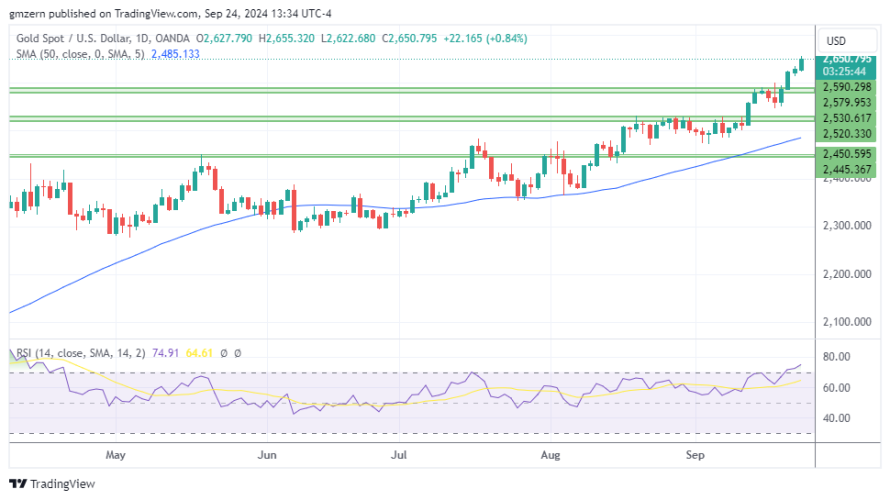
Alex Kuptsikevich, Senior Market Analyst at FxPro, sees gold prices attempting to break out of their recent triangle chart pattern.
“Gold has hit a glass ceiling at $2525 an ounce on the spot market, which it has been battling against for the past two weeks,” he said. “A series of smaller and smaller pullbacks and more frequent rallies to the resistance indicate impressive buying pressure. Under these conditions, we should expect a breakout to the historical highs soon, but it will be important to watch how the price behaves afterwards.”
Kuptsikevich said that over the past two weeks, a triangle of horizontal resistance and rising support has formed on the gold chart.
“This is a clear indication that buyers are taking the initiative at increasingly higher levels,” he wrote. “The same conclusion can be drawn if we look at the longer-term chart period since April, when the trend of increasingly shallow corrections continued. The current consolidation is an oscillation around the upper boundary of the uptrend since then.”
He noted an ongoing divergence between the RSI and the price trend, which he characterized as a sign of upward exhaustion. “However, we saw a similar situation from October 2023 to February 2024, which was followed by a strong uptrend rather than a short-term uptrend,” he noted.
“One of the main drivers of the gold price over the past two months has been the dollar's near 5% weakness against a basket of major currencies, which largely explains the 8.5% appreciation in the ounce,” Kuptsikevich said. “However, we note that the DXY is attempting to reverse its direction to the upside as it reaches the lower end of its trading range in early 2023.”
Taken together, he said that these signals “point to a likely near-term break of resistance with a renewal of historical highs, which could be followed by a medium- or even long-term reversal in the dynamics of the gold price.”
“If we take a look beyond the charts, gold's short-term fate will be determined by the Fed's monetary policy outlook: how much it will cut interest rates before the end of the year,” he concluded. “The monthly Employment report on September 6th and the CPI on the 11th will help clarify the answer.”
“Down,” said Mark Leibovit, publisher of the VR Metals/Resource Letter. “Have hedge long positions. Looking for a correction.”
Moor Analytics Founder Michael Moor believes the risks to gold prices are skewed to the downside, but the yellow metal could still post gains in the near term. “The trade back below 2558 (+3.3 tics per/hour) warns of renewed pressure. The trade below 25417 (+2.5 tics per/hour starting at 5:00am) further warns of pressure: but if we break back above decently, look for decent strength. Decent trade above 25537 (-1 tic per/hour starting at 5:00am) will warn of decent strength.”
Ole Hansen, Head of Commodity Strategy at Saxo Bank, expects gold to trade lower during the week ahead. “Gold is running low on energy, so looking for consolidation/correction ahead of Sept FOMC meet,” he said.
And Kitco Senior Analyst Jim Wyckoff still sees a favorable picture for gold prices next week. “Steady-higher as charts remain bullish, fundamentals remain friendly,” he said.
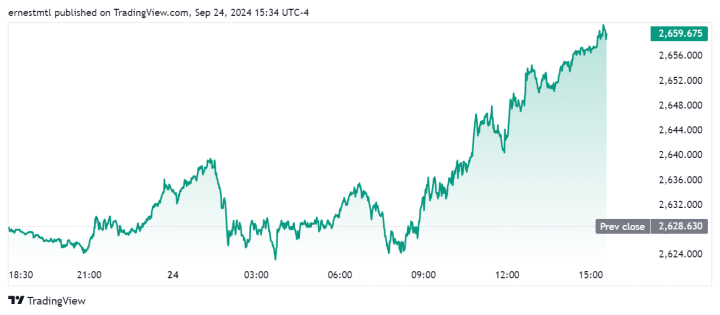
At the time of writing, spot gold last traded at $2,503.19 per ounce for a loss of 0.71% on the day and 0.35% on the week.
Kitco Media
Ernest Hoffmanr
Time to Buy Gold and Silver
Tim Moseley