Tag Archives: kinesismoney system

Gold futures bullish sentiment result in the largest daily gain since October 2023

Gold futures bullish sentiment result in the largest daily gain since October 2023

Gold futures bullish sentiment result in the largest daily gain since October 2023 teaser image

Exceptional, phenomenal, amazing, surprising, astounding, and almost beyond belief are only a few of the many words that can be used to describe today’s exceedingly strong upside breakout in gold futures. Gold opened today at $2052.82 and by the close of Globex at 5:00 PM ET gold futures are up $41. At the close, the most active April gold futures contract is trading at $2095.70, a 2% daily gain.

Now that gold futures have concluded for the week and the first trading day of March, the only regular break to gold’s 24-hour trading day (excluding holidays) market participants, investors, and traders are all beginning to have a more comprehensive understanding and explanation as to why gold moved 2% in a single day. The difficulty here is that there was no unexpected fundamental report or event that led to such a tremendous price gain in a single day.

There was no single news event, expected data report, or even a black swan event (an unpredictable or unforeseen event, typically one with extreme consequences) that could simply answer this question. What we do know is this large of a move does not occur frequently.

Today’s gains were the largest daily gain since Friday, October 13. On that day gold futures opened at $1921.70 and closed at $1983.80 and gained approximately $62 in a single day.

So what we must assume is there is a high probability that today’s spike was caused by events that occurred recently that are just beginning to get digested and interpreted in a new light or different way. The one big similarity to last week’s trading range is that Friday’s gain contained the vast majority of the weekly gain. On a weekly basis, gold gained $46.30 which is a 2.26% gain on the week, of which 2% of that gain occurred today. Last week gold gained $25.30 which is a 1.25% gain on the week, of which $18.70 or 92.1% of the gain occurred last Friday, February 23.

However, that fact delivers very little insight if any at all as to why gold had the single largest daily gain in the last five months.

The chart above is a five-minute Japanese candlestick chart of April gold futures. The first blue arrow on the left marks the beginning of the trading day with gold opening at $2052.82. Approximately 3 ½ hours later gold would trade to its low of approximately $2047 and begin the first leg of two rallies that would take gold dramatically higher. Gold would trade from $2047 up to $2066 in just over two hours before trading to another low of $2051, which was above the daily low and was a precursor to the dramatic second leg of the rally which took gold from $2051 to its high above $2096 before trading sideways are consolidating and currently at $2091.60 its settlement price for the week.

The next chart we want to look at is a five-minute candlestick chart of the dollar index which traded to a high today of 104.324, a low of 103.859, and settled down 0.24% at 103.904. The dollar traded with some volatility today, compared to what was witnessed in gold futures.

The chart above is a daily candlestick chart of gold which shows the incredibly large and dynamic price spike in one single candlestick which more than anything else clearly illustrates the importance and magnitude of today’s single move. All we can say is that most likely it was a combination of many events in which market sentiment shifted. The first and most obvious one to look at would be a renewed belief that the Federal Reserve will cut rates sooner than expected.

This could stem from the latest inflation report coming in close to the anticipated target. But luckily we have the weekend to aggressively analyze and dissect today’s rally so that on Monday we can bring you a more concise attempted understanding of today’s move.

Kitco Media

Gary Wagner

Time to Buy Gold and Silver

Tim Moseley

Are investors swapping their gold for Bitcoin as inflation fears rise?

Are investors swapping their gold for Bitcoin as inflation fears rise?

For months now, economists have warned consumers that inflation will be a challenging monster to slay, that that last push to get prices below 2% will be a hard mile, or a tough row to hoe; take your pick of analogies or metaphors because they are all true.

This past week, we saw both consumer and producer prices rise more than expected, and while prices have come down from their 2022 peaks, we are still a long way from the Federal Reserve’s target of 2%.

Gold and silver prices dropped to multi-month lows, testing critical support at $2,000 and $22 an ounce, respectively. Investors continue to flee the gold market as higher-for-longer interest rates support higher bond yields and a stronger U.S. dollar.

Instead of gold, investors continue to push equities to record highs, and they also see new opportunities in Bitcoin. This past week, Kitco’s Jordan Finneseth noted that so far this year, more than $3 billion has flowed out of global gold-backed exchange-traded products. At the same time, the newly approved Bitcoin ETFs have seen total inflows of $4.115 billion.

Finneseth noted that with inflows of $4 billion, the cryptocurrency ETFs achieved in one month what took the gold market two years.

However, even in this difficult environment, we still must acknowledge the underlying strength of the precious metals market.

Despite the selling pressure, the precious metals were able to hold critical support levels. Silver, in particular, has rallied 7% from its lows earlier this week. Gold and silver may not be attractive assets as the Federal Reserve maintains its aggressive monetary policy stance; however, very few investors are actively shorting these assets.

Along with the inflation threat, fears of a recession have not completely disappeared; at the same time, there is enough geopolitical uncertainty to maintain a robust safe-haven bid in gold.

Let’s also not forget that a healthy physical gold market provides some price support. According to the National Retailers Federation, U.S. consumers were expected to spend a record $6.4 billion in jewelry for this year’s Valentine's Day. Jewelry purchases represented a significant portion of the $25.8 billion expected to be spent on gifts ahead of Feb. 14.

Meanwhile, China continues to assert its dominance in the gold market. According to a report from the World Gold Council, China’s gold market set all-time highs in several sectors in January. The WGC noted that 271 tonnes of gold was withdrawn from the Shanghai Gold Exchange last month, the busiest January on record and the third-biggest in the exchange’s entire history. Total holdings in Chinese-listed gold ETFs hit a record high last month At the same time, the People’s Bank of China continued to buy gold for the 15th consecutive month.

Despite the selling pressure in the gold market, there are some significant pillars of strength, and for many analysts, buying on dips is seen as a solid tactical investment.

Kitco Media

Neils Christensen

Time to Buy Gold and Silver

Tim Moseley

Gold Price News: Gold Edges Lower Finds Support at 2020 An Ounce

Gold Price News: Gold Edges Lower, Finds Support at $2,020 An Ounce

gold edges lower finding support at 2020 per once

Gold prices edged slightly lower overall on Thursday in largely lacklustre trading, with prices recovering later in the session from earlier lows

Prices dipped as low as $2,020 an ounce in the early afternoon session but picked up again to trade at around $2,032 an ounce later in the afternoon. That compares with a high of $2,043 on Wednesday.

gold price kinesis exchange kau dollar

Kinesis gold (KAU) price – $/g – from Kinesis Exchange

US Initial Jobless Claims figures came out on Thursday showing that the number of people claiming unemployment benefits in the US fell by 9,000 to 218,000 in the most recent week, a slightly lower number than the market’s expected 220,000.

Overall, gold has shown a slight downward bias through the week as a whole, albeit with prices finding solid support below the $2,020 an ounce mark.

The jobless figures were not enough to provide any convincing price momentum in either direction, with eyes on further upcoming data to gauge the chances of any changes in interest rate policy by the US Fed.

Lower interest rates eventually are likely to provide a tailwind for gold prices, although recent economic data has been too strong to allow the US Fed to cut rates in the short-term, according to a report released Wednesday by the World Gold Council: Gold Market Commentary: Inflation risks seep back in | World Gold Council.

Moreover, Red Sea tensions have started to impact freight costs, which could lead to more general supply chain pressures that have contributed to higher inflation in the past, it said. Persistent high inflation maintains pressure on central banks to keep interest rates higher, in turn putting downward pressure on precious metals prices.

Frank Wilson

Time to Buy Gold and Silver

Tim Moseley

Fed hikes may have concluded as central banks purchase gold at a record level

Fed hikes may have concluded, as central banks purchase gold at a record level

Gold had tremendously strong gains today of just over $20 per ounce in both physical gold as well as futures. As of 4:00 PM EST gold futures basis the December contract is currently up $20.80 or + 1.05%, and fixed at $2001. On its first day as the most active Comex contract, February gold (GC G24) gained $20.60 or + 1.03% and is currently fixed at $2021.10. Physical or spot gold is up $20.80 trading at $1998.40.

Today’s solid gains are the result of multiple factors. First, the release of economic reports indicates that the economy in the United States has been contracting as a result of recent rate hikes by the Federal Reserve. Secondly, the Federal Reserve released its minutes from the last FOMC meeting in which the Fed continued to maintain its current interest rate level.

Third, a report by the World Gold Council revealed intensified buying by central banks around the world resulting in a new record for purchases in the first nine months of the year. Lastly, except for the Federal Reserve, global central banks are beginning to cut interest rates.

It was a combination of all the events cited above that propelled gold futures above $2000 per ounce.

The World Gold Council has updated its list of gold reserves by countries revealing that many central banks aggressively added to their gold reserves. Collectively these purchases by global central banks are at a record pace for the first three quarters of 2023 which totals 800 tons, with China Poland, and Singapore being the primary buyers. This pace is well above the total purchases for the same period in 2022.

Will the Fed follow the pack and cut rates sooner than anticipated?

Today the Federal Reserve released its minutes for the most recent FOMC meeting. The minutes supported current expectations that the Federal Reserve’s pause not only will continue, but more importantly signals that the Fed might have concluded its aggressive interest rate hikes that began in March 2022. These hikes have effectively raised the Fed funds rate from between 0 and ¼% to between 5 ¼% and 5 ½%. Expectations by the CME’s FedWatch tool indicate the probability of a rate hike pause is 94.8% down from the probability of 99.8% a week ago.

Adding to these bullish developments that took gold futures above $2000 per ounce is the fact that multiple central banks have begun interest rate cuts.

In fact, for the first time since January 2021, the number of central banks that are cutting interest rates is greater than the number of central banks implementing rate hikes.

While the Federal Reserve’s monetary policy has not mentioned any imminent rate cuts the fact that many other central banks are cutting rates is positive. Although the ECB has not begun to cut its interest rate level, expectations are high that they have ended their cycle of rate hikes and could begin rate cuts as early as the second quarter of 2024.

Gary S. Wagner

By

Gary Wagner

Contributing to kitco.com

Time to Buy Gold and Silver

Tim Moseley

Gold prices pull back as Middle East tensions ease silver maintains bullish bias – DailyFX’s Snow

Gold prices pull back as Middle East tensions ease, silver maintains bullish bias – DailyFX's Snow

Gold prices have come off their recent highs due to successful diplomatic efforts which have allowed for a near-term de-escalation in the Middle East, according to Richard Snow, Strategist at DailyFX.

In his analysis, Snow noted the recent agreement that will see aid flowing to the civilian population in Gaza after two Israeli hostages were released. “This and other ongoing conversations could result in a momentary respite in what has otherwise been a frantic war with the potential to spillover into a regional conflict,” he wrote.

Snow said he believes that the gold market has taken this an opportunity to take some risk off the table and reassess the next move. “Panic buying of the safe haven metal led gold higher, only showing a loss of momentum around the $1985 level,” he wrote.

The 30-day expected gold volatility index (GVZ) has escalated towards levels not seen since the collapse of SVB amidst the regional banking turmoil earlier this year. “Such a surge in expected volatility suggests gold is likely to remain well supported as GVZ tends to rise more when gold prices accelerate,” he said.

Silver has risen as well, Snow noted, but not to the same degree as the safe-haven yellow metal.

“XAG/USD rose and breached the 200-day simple moving average, posting a close marginally above the line,” he wrote. “The long upper wick provided the first clue of waning bullish momentum and since then, silver has been on the decline.”

Snow pointed out that the temporary reprieve highlights the 38.2% Fibonacci retracement of the 2021 to 2022 major move around 22.35. “However, the bullish bias remains intact, with a return to 23.20 not out of the question and even a possible advance towards the 50% Fibonacci level as a guideline,” he wrote.

By

Ernest Hoffman

For Kitco News

Time to Buy Gold and Silver

Tim Moseley

Analysts expect gold to kick off Q4 with gains while retail investors are evenly split

Analysts expect gold to kick off Q4 with gains, while retail investors are evenly split

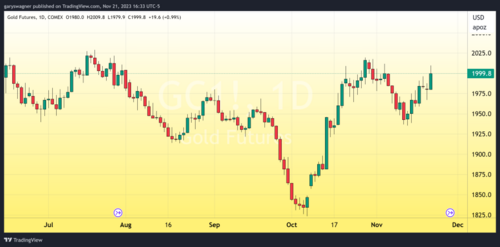
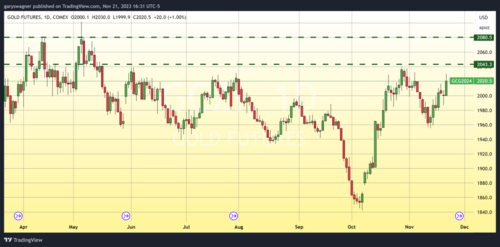
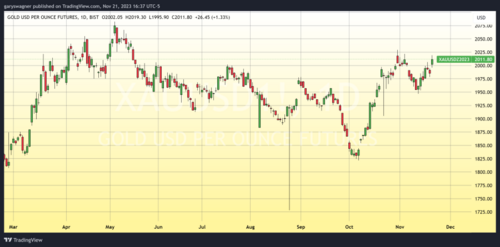
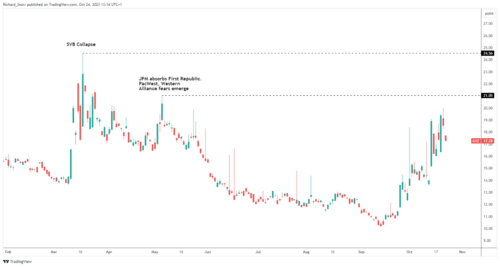
Gold prices underwent a dramatic selloff this week, continuing and accelerating the downtrend that began after the Federal Reserve left interest rates unchanged on the 20th and reiterated that rates would remain higher for longer than previously anticipated.

The latest Kitco News Weekly Gold Survey sees most market analysts optimistic that gold will see a bounce in the near term, while retail investors are more evenly divided after experiencing seven straight sessions of losses.

Everett Millman, Chief Market Analyst at Gainesville Coins, attributed gold's recent slide largely to seasonal factors and options contracts expiring, and sees the precious metal rebounding to start the fourth quarter.

"My initial reaction to the downturn this week was that it had a lot to do with the options expiry on Comex, which does usually lead to a lot of downside volatility as people are closing out or rolling over contracts," he said. "But given that this price action continued throughout the rest of the week, I'm also going to attribute that a bit to seasonality. The gold market usually goes into a slumber in the late summer, early autumn months. We saw that exact same pattern last year. Unless markets are interpreting the FOMC to be extremely hawkish, which I don't think is what's going on, I think you have to chalk it up to seasonality and just the regular trading dynamics that come at this time of year."

"Usually October, the beginning of the fourth quarter, is when you see the tide turn the opposite direction," Millman said. "It's when we get a lot of gold buying events out East, in both India and China. India has the Diwali festival coming up in early November, a lot of buyers over there start accumulating gold in the weeks preceding that."

"I would expect to see gold, if not at the beginning of October, certainly by the beginning of November, to see prices on the rise again."

James Stanley, senior market strategist at Forex.com, believes gold could fall further in the first week of October. "The rates theme has markets on edge and gold's behavior since FOMC has been aggressively bearish with both spot and futures taking out a number of supports along the way," Stanley said. "There's no evidence that's finished yet."

This week, 13 Wall Street analysts participated in the Kitco News Gold Survey. Seven experts, or 54%, expected to see higher gold prices next week, while four analysts, or 31%, predicted a drop in price. Only two analysts, or 15%, were neutral on gold for the coming week.

Meanwhile, 540 votes were cast in online polls. Of these, 245 retail investors, or 45%, looked for gold to rise next week. Another 219, or 41%, expected it would be lower, while 76 respondents, or 14%, were neutral about the near-term prospects for the precious metal.

Kitco Gold Survey

Wall Street

Bullish54%

Bearish31%

Neutral15%

VS

Main Street

Bullish45%

Bearish41%

Neutral14%

The latest survey shows that retail investors expect gold to trade around $1,872 per ounce next week, which is $64 below last week's prediction, but which would still represent a gain of $23 from the current spot price.

The coming week will see the release of the ISM Manufacturing and Services PMIs for September along with over a dozen speeches by U.S. and European central bankers, including Fed chair Jerome Powell and ECB president Christine Lagarde. The highlight of the week will be the Nonfarm Payrolls report for September, which is slated for release on Friday morning, but which could be canceled if the U.S. government shuts down.

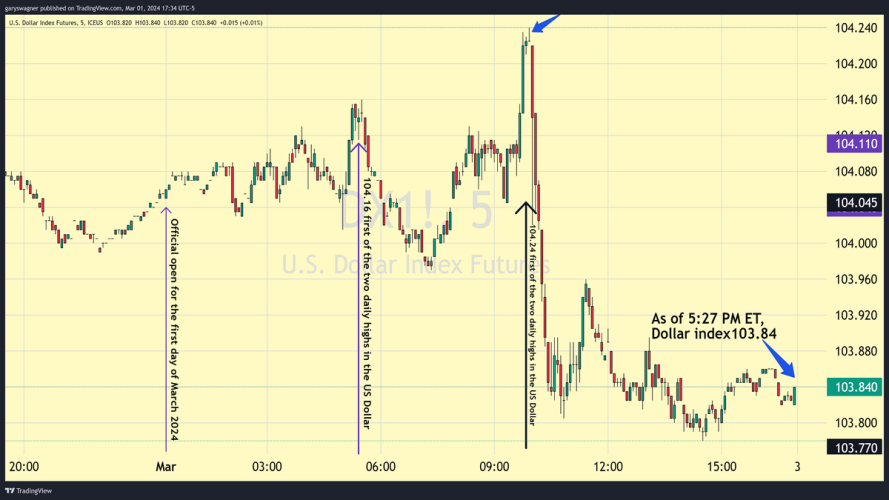
Mark Leibovit, publisher of the VR Metals/Resource Letter, sees gold prices rising next week as the greenback pulls back. "Bullish, as it appears the U.S. dollar may be forming a trading top," he said.

Darin Newsom, Senior Market Analyst at Barchart.com, shared a technical case in favor of gold gaining ground next week.

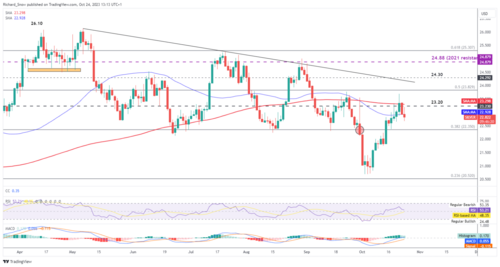
"While the long-term trend and intermediate-term trends remain down, Dec gold's short-term daily chart is showing the contract to be sharply oversold," Newsom said. "Daily stochastics established a bullish crossover below 20% at Thursday's close, a signal the short-term trend is set to turn up. It's possible, maybe not probable, Dec23 completes a bullish 2-day reversal Friday. To do so, it would need to rally and close near the daily high. If that doesn't happen, a bullish reversal pattern will be delayed for a bit."

Marc Chandler, Managing Director at Bannockburn Global Forex, also sees upside potential for gold as the fourth quarter gets underway. "I look for gold to bottom shortly," Chandler said. "Soft US core inflation helping US rates stabilize and the dollar's pullback should help the yellow metal. Month-end and quarter-end flows may be distorting the immediate picture, but the headwinds on the US economy look set to intensify: tightening of credit, the cumulative effect of rising rates, deposits still leaving banks, the resumption of student debt servicing, the likely partial closure of the US federal government, and the high energy price may sap the strength of the US economy."

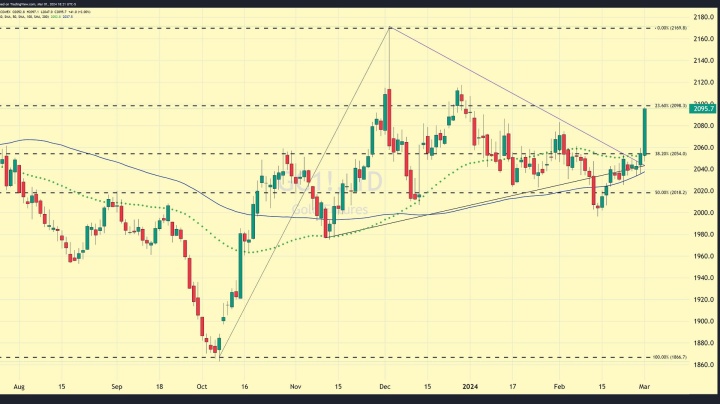
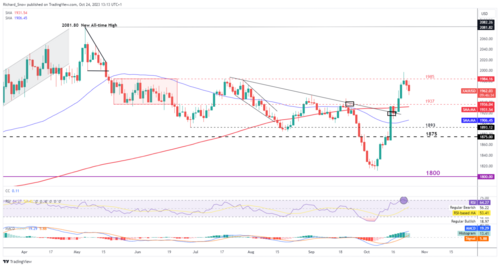
Looking at the technical picture, Chandler said, "I would be inclined to buy gold on further weakness and look for a move to $1885 to stabilize the technical tone and a move $1892 to boost confidence a low is in place."

"Funds are still holding a net-long futures position, not changing it much over the course of September," Newsom noted, "so with the end of the quarter in sight, it could lead to some long-liquidation."

Adam Button, Chief Currency Analyst at Forexlive.com, still believes bonds and the U.S. dollar will dictate the precious metal's trajectory in the near term, but he sees a silver lining to gold's recent weakness.

"There's a wonderful seasonal gold trade that kicks off in November, and this is setting up very nicely for a test of $1800, and then strength November through January," Button said. "Obviously the bonds are the catalyst here. Right now, you can buy a three-month T-bill, five and a half percent, 10-years, four and a half percent, and gold still yielding zero. The yield difference between gold and other traditional safe havens is painful at the moment, especially in an environment with a rising dollar."

He said gold bulls believed the Fed would be signaling an end to rate hikes by this point. "Instead, there was talk this week about extending the hiking cycle into 2024, Kashkari was a pretty big catalyst saying that, a 40 percent chance that they have to keep hiking, perhaps significantly, in 2024."

Button believes gold will need to see weakness in U.S. economic data before any kind of sustained rally. "I suspect it's coming, but we may not be getting any economic data starting next week if the shutdown happens, at least not the top tier data," he said. "That stokes some economic weakness later. But now, say the shutdown last two weeks in October, then can you really trust the October data? Because it's all going to be skewed. I don't know… I think the market will probably figure out whether it's real or fake weakness, but it might look like weakness at least, which should be bullish for gold."

Button also agreed that quarter-end factors were in play this week, and he thinks there's a decent chance gold sees a bounce early next week. The price action today isn't particularly promising, but the day's not over," he said. "I don't have a huge amount of confidence we'll get a big bounce, but I'd say I'm neutral for next week."

And Kitco Senior Analyst Jim Wyckoff sees downside risks for the precious metal. "Steady-lower. Technicals bearish," Wyckoff said. "That means the path of least resistance for prices remains sideways to lower."

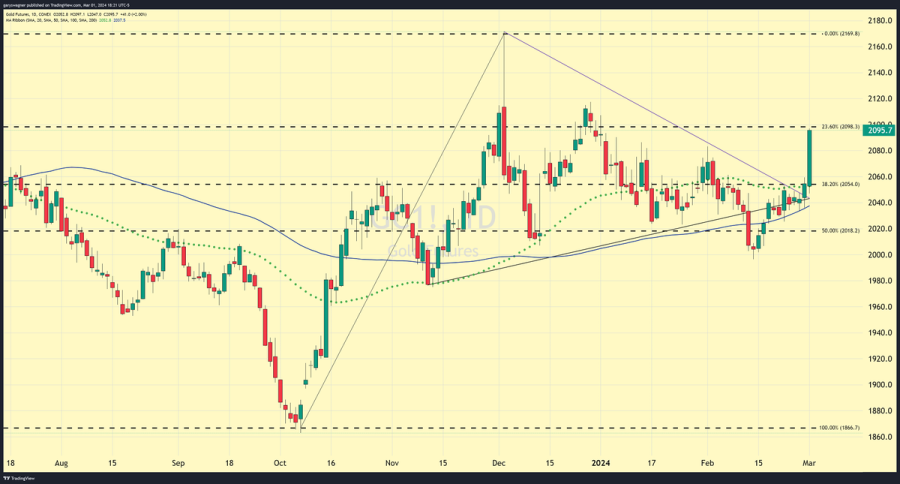
Gold prices are currently down 0.84% on the day and 4% on the week, with spot gold last trading near session lows at $1,849.09 an ounce at the time of writing.

By

Ernest Hoffman

For Kitco News

Time to Buy Gold and Silver

Tim Moseley

GoldSilver – New breakout levels in Gold and Silver with your buy level in Platinum

Gold/Silver – New breakout levels in Gold and Silver with your buy level in Platinum

Precious Metals had a volatile week led by a fury of economic data that the Federal Reserve is closely monitoring. The upward surprise in the ADP figure on Thursday was enough to take Platinum, Palladium, and down 1.5-2%, pushing Platinum below the psychological $900 mark. Following the data release, the ISM Services number came in at 53.9 versus the expectation of 51.3 driving the odds of a July interest rate hike up to 93.6%. The sell-off in the market was not limited to Precious Metals but broadened, with the S&P and Dow having the largest one-day sell-off since May. A reversal of fortune occurred on Friday, with seemingly opposite data showing 209k jobs created versus the expectation of 230,000, leaving the Federal Reserve scratching their heads. Will the Fed raise one more time or two? Either way, a Fed pivot is near, and the bottom in Gold is closer.

Daily Gold Chart


After four straight weeks of losses, we have the first signs of "exhaustive selling," indicating the potential for "bottoming action" in Precious Metals. Gold briefly tested the 200 DMA at $1904, where bargain hunters are beginning to emerge. The critical level we will watch next week will be $1943, where Gold futures failed on July 5th. Any close above could trigger a short covering rally to $1985. You will want to watch the psychological $2000 level and ultimately $2008 as your breakout level. Any close over $2008 should trigger a wave of buying up to all-time highs and eventually extend to our long-term target of $2500/oz. We anticipate that the Fed's reckless acceleration in interest rates will ultimately catch up with them, leading to a reversal in policy once a contraction in U.S. GDP occurs in Q1 2024 while an acceleration in the Euro Zone and China pressure the U.S. Dollar and Interest Rates.

To further help you develop a trading plan, I went back through two decades of my trading strategies to create a Free New "5-Step Technical Analysis Guide to Gold that can easily apply to Silver." The guide will provide you with all the Technical analysis steps to create an actionable plan used as a foundation for entering and exiting the market. You can request yours here: 5-Step Technical Analysis Guide to Gold.

Daily Silver Chart


Silver futures traded on either side of the 200 DMA for most of the week near $23, where new speculators are entering the market looking for a higher beta asset class to participate in once Gold breaks out. While a price setback would be temporary, our long-term thesis remains that tightness in the physical markets, a decline in mining supply, and solar and E.V. demand should offset any potential for prices to decline further. The new breakout level in Silver is $23.53, where traders will begin to cover shorts frantically. Our thesis remains that over the next 18-24 months, we expect Copper to make new all-time highs and Silver to break $35/oz.

Having the flexibility to enter and exit the market quickly makes it essential for Precious Metals investors to have a futures trading account alongside their core Physical Precious Metals holdings. If you are interested in speculating on the rise and fall of the price of Precious Metals on a shorter-term basis, such as two weeks or two months, or If you have never traded futures or commodities, check out this new educational guide that answers all your questions on transferring your current investing skills into trading "real assets," such as the 1000 oz Silver futures contract. You can request yours here: Trade Metals, Transition your Experience Book.

By

Phillip Streible

Contributing to kitco.com

Time to Buy Gold and silver

Tim Moseley

Gold flirts with a record high after three days of consecutive gains

Gold flirts with a record high after three days of consecutive gains

Gold futures have traded almost $100 higher from Tuesday's open to today's intraday high. Gold opened at approximately $1990 on Tuesday and closed at approximately $2022 after factoring in a daily gain of over $30. Yesterday gold had a moderate gain moving the most active June contract to an intraday high of $2049 and closing at approximately $2037.

However, today's range was the largest of the last 3 days trading to a low of $2038.50 and a high of $2085.40. As of 5:50 PM EDT most active June Comex gold contract is fixed at $2058.60 after factoring in a gain of $21.60 gaining just over 1%.

The Federal Reserve raised rates by ¼% yesterday, taking its benchmark Fed funds rate to its highest level since 2008. In fourteen months, the Fed has raised rates a total of ten times, once at every FOMC meeting since March 2022.

The Fed has taken its benchmark rate from near zero to between 5% and 5 ¼ %. More importantly, the Fed indicated it is ready to pause raising rates as it gauges the net effect of the rate hikes already implemented.

According to the CME's FedWatch tool, there is a 79.5% probability that the Federal Reserve will pause at its June FOMC meeting and maintain its current benchmark rate between 5% and 5 ¼%. However, more startling is the probability of 20.5% that the Federal Reserve will implement an interest rate cut of ¼%. This goes against the strong narrative and resolve that the Fed has maintained since the release of the December 2022 "Dot Plot".

Pausing rate hikes at the next FOMC meeting is an extremely logical move for the Federal Reserve. This will allow the Fed to assess the damage from recent bank failures, and gauge inflationary levels which will lag behind rate hikes already implemented by the Federal Reserve. A pause would also allow the Fed to wait for a resolution over the US debt ceiling dilemma.

The chart above is a weekly chart of the continuous contract of gold futures. The horizontal line is placed at the record high. The most likely outcome of this rally will be that the triple top will be taken out and result in a new record high for the price of gold.

By

Gary Wagner

Contributing to kitco.com

Time to Buy Gold and Silver

Tim Moseley

Gold futures close above 2000 for the first time since March 2022

Gold futures close above $2000 for the first time since March 2022

It has been just a little over one year ago that gold futures traded and closed above $2000 per ounce. On March 8, 2022 gold futures opened above $2000 per ounce, traded to a high of $2078 and closed at approximately $2043. Even though gold futures were able to close well above $2000, that price point was unsustainable. On the following day, March 9, 2022, gold opened at approximately $2060 and strong selling pressure drove prices back below $2000 closing at $1988.

Two weeks ago, gold challenged the key psychological level of $2000 per ounce on three occasions, however, gold was unable to sustain gains above $2000 on each occasion.

Today, the most active June 2023 futures contract opened at $1990, traded to a high of $2008, and as of 5:40 PM EST is fixed at $2001.70. Gold futures gained $15.50 or 0.78%.

Bullish market sentiment for gold has been evident since November of last year after hitting a triple bottom at approximately $1620 (from September to November). November 3 marked the lowest value of the triple bottom and the end of a multi-month correction. The first leg of the current bull market moved gold from $1620 to approximately $1975 during the first week of February.

The chart above is a 480-minute bar chart of gold futures (June contract month). It highlights a Western technical chart pattern called a triangle. According to topstockresearch.com, Symmetric Triangles are another type of triangle chart pattern used by traders. Again, like ascending and descending triangles it takes a few weeks to a few months for this type of pattern to form.

This pattern is composed of a lower ascending trendline which acts as support, and an upper descending trendline which forms the current level of resistance. Prices in this pattern will oscillate between the upper-level resistance trendline and the lower-level support trendline. During a bullish market scenario, you look for pricing to break above resistance, this typically occurs after multiple attempts to breach either the low or the high occurs with a breakout to the upside.

The question as to whether or not gold will be able to sustain its pricing above $2000 per ounce can only be answered after it has held that price point on a closing basis for a number of days.
 

By

Gary Wagner

Time to Buy Gold and Silver

Tim Moseley

Central banks are replacing dollars with gold

Central banks are replacing dollars with gold
 

The economy started the year on a strong note, and the gold market is taking a hit. The Federal Reserve might need to raise rates more than expected since inflation is not coming down fast enough.

Here's a look at Kitco's top 3 stories of the week:

3. Macro data: Gold price drops below $1,850 as U.S. retail sales surprise on the upside in January

2. Frank Giustra warns that the dollar will be dethroned in 'bifurcated' global monetary system

1. Billionaire John Paulson: central banks are replacing dollars with gold, you are better off investing in precious metal than USD

By Anna Golubova

For Kitco News

Time to Buy Gold and Silver

Tim Moseley