Tag Archives: kinesismoneysystem

Gold weaker – volatility collapse portends bigger price move soon

Gold weaker – "volatility collapse" portends bigger price move soon

Gold prices are modestly lower in midday U.S. trading Wednesday, in more subdued mid-summer trading. However, there has been a “collapse in volatility” on the daily bar chart, which suggests a significantly bigger price move is on the horizon in gold—possibly yet this week. Given that gold prices are trending lower on the daily chart, odds favor that bigger price move being on the downside. Improved trader/investor risk appetite this week is keeping buyers in the safe-haven metals mostly standing on the sidelines. August gold futures were last down $4.90 at $1,705.80. September Comex silver futures were last up $0.042 at $18.76 an ounce.

Global stock markets were mostly higher overnight. U.S. stock indexes are firmer near midday. The U.S. stock index bulls are having a good week so far and have restarted near-term price uptrends on the daily charts. Corporate earnings reports are on the front burner of the stock markets this week. Otherwise, its summertime doldrums trading amid a lack of major, fresh news.

Traders and investors are looking ahead to Thursday when the European Central Bank holds its regular monetary policy meeting. The ECB is expected to raise interest rates for the first time in 11 years, with many market watchers looking for a 0.5% rate increase. The U.S. Federal Reserve is expected to raise its key interest rate by at least 0.75% at next week’s FOMC meeting.

Copper/gold ratio shows Fed monetary policy is too tight – MKS PAMP

The key outside markets today see Nymex crude oil prices weaker and trading around $103.50 a barrel. The U.S. dollar index is slightly higher in midday U.S. trading. The yield on the 10-year U.S. Treasury note is fetching 3.164%. The 2-year and 10-year Treasury bond yields remain inverted at mid-week, which is one clue of an impending U.S. economic recession.

Technically, August gold futures bears have the solid overall near-term technical advantage. Prices are trending lower on the daily bar chart. However, the recent “collapse in volatility” on the daily bar chart (whereby at least three price bars in a row are significantly smaller than previous price bars) suggests a bigger price move is coming soon. It’s important to note that markets typically vacillate between periods of higher volatility and lower volatility, and at present the gold market is in a period of low volatility. Bulls’ next upside price objective is to produce a close above solid resistance at $1,750.00. Bears' next near-term downside price objective is pushing futures prices below solid technical support at $1,650.00. First resistance is seen at this week’s high of $1,722.00 and then at $1,735.00. First support is seen at $1,700.00 and then at the July low of $1,695.00. Wyckoff's Market Rating: 1.5.

September silver futures bears have the solid overall near-term technical advantage. Silver bulls' next upside price objective is closing prices above solid technical resistance at $20.00. The next downside price objective for the bears is closing prices below solid support at $17.00. First resistance is seen at today’s high of $19.03 and then at $19.36. Next support is seen at this week’s low of $18.51 and then at $18.00. Wyckoff's Market Rating: 1.5.

September N.Y. copper closed up 405 points at 333.05 cents today. Prices closed near mid-range today. The copper bears have the solid overall near-term technical advantage. A steep six-week-old price downtrend is in place on the daily bar chart. Copper bulls' next upside price objective is pushing and closing prices above solid technical resistance at 375.00 cents. The next downside price objective for the bears is closing prices below solid technical support at 315.00 cents. First resistance is seen at today’s high of 337.55 cents and then at 340.00 cents. First support is seen at 325.00 cents and then at the July low of 313.15 cents. Wyckoff's Market Rating: 1.5.

By Jim Wyckoff

For Kitco News

Time to buy Gold and Silver on the dips


Tim Moseley

Gold silver near steady – new fundamental inputs awaited

Gold, silver near steady – new fundamental inputs awaited

Gold and silver prices are trading not far from unchanged in midday U.S. trading Tuesday. A big drop in the U.S. dollar index this week is limiting selling interest in the precious metals. However, rising U.S. Treasury bond yields this week and a wobbly crude oil market are squelching the bulls. A lack of fresh, markets-moving economic or geopolitical news in mid-summer has metals traders languishing and looking more at the outside markets for direction. August gold futures were last up $0.90 at $1,711.10. September Comex silver futures were last down $0.105 at $18.735 an ounce.

Global stock markets were mixed overnight. U.S. stock indexes are solidly higher at midday. Corporate earnings reports are on the front burner of the stock markets this week. Otherwise, its summertime doldrums trading amid a lack of major, fresh news this week.

In overnight news, the Euro zone consumer price index report for June came in at up 8.6%, year on year, which was right in line with market expectations.

Traders and investors are looking ahead to Thursday when the European Central Bank holds its regular monetary policy meeting. The ECB is expected to raise interest rates for the first time in 11 years, with many market watchers looking for a 0.5% rate increase. The U.S. Federal Reserve is expected to raise its key interest rate by at least 0.75% at next week’s FOMC meeting.

The gold market has turned bearish

The key outside markets today see Nymex crude oil prices firmer and trading around $103.00 a barrel. The U.S. dollar index is solidly lower again today. The yield on the 10-year U.S. Treasury note is fetching 3.00%.

Technically, August gold futures bears have the solid overall near-term technical advantage. Prices are in a four-month-old downtrend on the daily bar chart. Bulls' next upside price objective is to produce a close above solid resistance at $1,750.00. Bears' next near-term downside price objective is pushing futures prices below solid technical support at $1,650.00. First resistance is seen at this week’s high of $1,722.00 and then at $1,735.00. First support is seen at the July low of $1,695.00 and then at $1,685.00. Wyckoff's Market Rating: 1.0.

September silver futures bears have the solid overall near-term technical advantage. Silver bulls' next upside price objective is closing prices above solid technical resistance at $20.00 an ounce. The next downside price objective for the bears is closing prices below solid support at $17.50. First resistance is seen at $19.00 and then at $19.36. Next support is seen at today’s low of $18.51 and then at $18.00. Wyckoff's Market Rating: 1.5.

September N.Y. copper closed down 520 points at 329.30 cents today. Prices closed near mid-range today. The copper bears have the solid overall near-term technical advantage. A steep six-week-old price downtrend is in place on the daily bar chart. Copper bulls' next upside price objective is pushing and closing prices above solid technical resistance at 375.00 cents. The next downside price objective for the bears is closing prices below solid technical support at 315.00 cents. First resistance is seen at this week’s high of 337.10 cents and then at 340.00 cents. First support is seen at 325.00 cents and then at the July low of 313.15 cents. Wyckoff's Market Rating: 1.5.

By Jim Wyckoff

For Kitco News

Time to buy Gold and Silver on the dips


Tim Moseley

AM-PM Roundup Gold price near steady but bears maintain firm overall grip

Gold prices are trading not far from unchanged and near this week’s 11-month low in early U.S. trading Friday. Silver prices are firmer on short covering after hitting a two-year low this week. Bullish outside market forces on this day are friendly for the metals, as the U.S. dollar index is lower, crude oil prices are firmer and bond yields have backed off a bit. However, the overall postures of those three key elements still lean bearish for the metals and continue to keep their prices tamped down. August gold futures were last up $0.50 at $1,706.20. September Comex silver futures were last up $0.23 at $18.45 an ounce.

Global stock markets were mixed overnight. U.S. stock indexes are pointed toward mixed openings when the New York day session beings. It’s a busy U.S. data day to end the trading week, highlighted by the retail sales report for June. Sales came in up a slightly higher-than-expected up 1.0%. Sales were forecast up 0.9% compared to the May report that was down 0.3%. Markets showed no significant reactions to the data.

Other U.S. economic data due for release Friday includes the Empire State manufacturing survey, import and export prices, industrial production and capacity utilization, manufacturing and trade inventories and the University of Michigan consumer sentiment survey.

In overnight news, China, the world’s second-largest economy, reported its GDP cooled sharply in the second quarter due to Covid lockdowns. China’s GDP was up just 0.4%, year-on-year. That was below market expectations and the lowest since the first quarter of 2020, when the pandemic began.

Gold hammered, analysts warn of capitulation event if price drops below pre-pandemic levels

The commodity markets have sent two strong, early signals to the marketplace the past couple weeks that traders and investors need to heed. Crude oil, gold, copper, silver, the grains, coffee, cotton and other markets have posted very sharp losses. Those two signals are one, that price inflation overall has very likely peaked, and two, that the U.S. and other major economies are on the verge of recession, if not already there. The smart money in the marketplace will not be making trades counter to those two strong signals.

The key outside markets today see Nymex crude oil prices higher and trading around $97.00 a barrel. The U.S. dollar index is weaker in early U.S. trading. The yield on the 10-year U.S. Treasury note is fetching 2.93%.

Technically, the August gold futures bears have the solid overall near-term technical advantage. Bulls’ next upside price objective is to produce a close above solid resistance at $1,750.00. Bears' next near-term downside price objective is pushing futures prices below solid technical support at $1,700.00. First resistance is seen at $1,715.00 and then at $1,725.00. First support is seen at this week’s low of $1,695.00 and then at $1,685.00. Wyckoff's Market Rating: 1.0

September silver futures bears have the solid overall near-term technical advantage as prices hit a two-year low overnight. Silver bulls' next upside price objective is closing prices above solid technical resistance at this week’s high of $19.36. The next downside price objective for the bears is closing prices below solid support at $17.00. First resistance is seen at $18.63 and then at $19.00. Next support is seen at $18.00 and then at $17.75. Wyckoff's Market Rating: 1.0.

By Jim Wyckoff

For Kitco News

Time to buy Gold and Silver on the dips

Tim Moseley

Gold price holding support at 1700 as US retail sales rise 1 in June

Gold price holding support at $1,700 as U.S. retail sales rise 1% in June

The gold market is holding support at $1,700 as U.S. consumers appear to be on solid footing, buying more than expected in June.

U.S. retail sales advanced 1.0% last month following a upwardly revised drop of 0.1% in May, according to the latest data from the U.S. Commerce Department. Economists were expecting to see a rise of 0.9% in last month’s headline number.

Core sales, which strip out vehicle sales, also beat expectations and were up 1% last month versus the projected advance of 0.7%. The report’s control group, which strips out autos, gas, building materials, and food services, increased 0.8%, beating expectations of a 0.3% gain.

The strong gains in retail sales comes as consumers saw inflation rise to its highest level in 40 years last month.

The gold market is seeing little reaction to the latest positive economic data. August gold futures last traded at $1,702.30 an ounce, down 0.23% on the day.

Economists note that the strong rise in retail sales will help ease fears that the U.S. is close to a recession. Economists have also said that the data also supports the Federal Reserve’s aggressive monetary policy stance.

While some economists are optimistic on the health of the U.S. economy others are skeptical. Katherine Judge, senior economist at CIBC, said that consumers are still faced with falling purchasing power, which will continue to impact consumption.

“Retail sales bounced back in the US in June, but much of the advance owes to higher prices,” she said. “These figures will clearly look less impressive in volume terms, and we expect the erosion in consumer purchasing power to weigh on goods spending ahead.”

By Neils Christensen

For Kitco News

Time to buy Gold and Silver on the dips


Tim Moseley

Will 1700 become a sustainable support level for gold?

Will $1700 become a sustainable support level for gold?

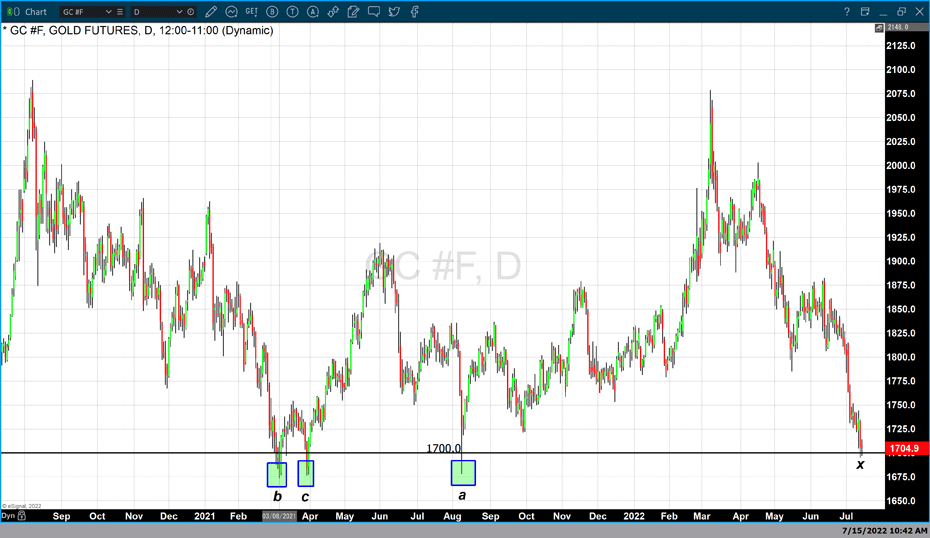
Over the two trading days gold futures have traded below $1700 (marked X) and, on both occasions, recovered closing above that case psychological level. So, it is not illogical to wonder whether or not this price point will become a sustainable level of support or simply a pause before gold heads to lower prices.

Historically speaking the last time gold traded below $1700 occurred on August 9, 2021, the day of the "flash crash”. On Monday, August 9, 2021(marked a) gold opened at $1765 traded to a low of $1678, and closed at $1726. In this instance, $1700 played little technical importance within that one-hundred-dollar trading range. Before that gold traded below $1700 on two occasions in March 2021.

In both instances, gold traded to a low of approximately $1678. At the beginning of March 2021(marked b) gold traded below $1700 for three consecutive days before it moved above that price point. During the second instance that occurred at the end of March (marked c) gold broke below 1700 and then on the following day open below 1700 but closed well above that price point.

While historical studies can reveal many aspects and identify technical support and resistance levels, each identified example was caused by underlying fundamental events based on a unique set of factors and therefore may only offer fractional insight. More so, in each example over the last two years in which gold traded below $1700, it resulted in much lower prices before concluding and trading back above that price point. In fact, in all three examples highlighted on the chart, the price decline resulted in gold quickly moving below $1700 and trading to approximately $1680 before finding support.

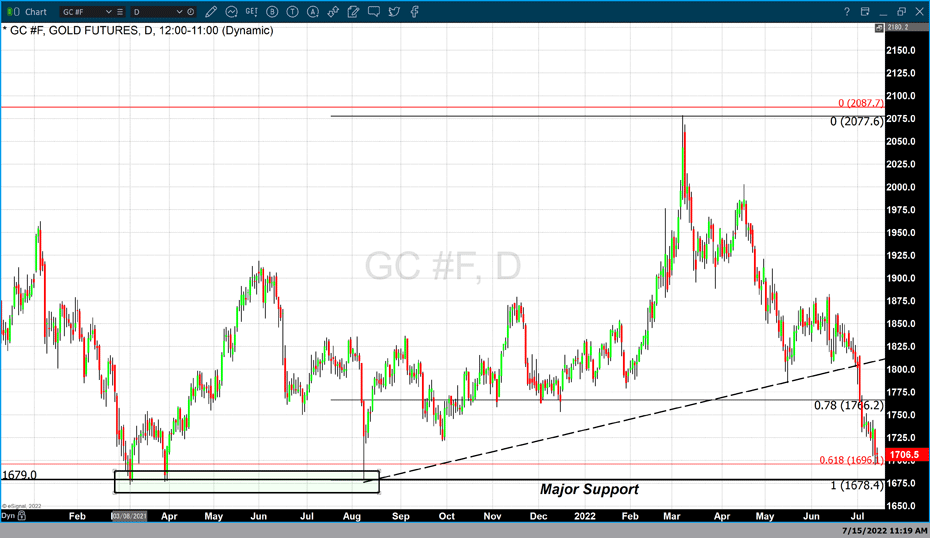
The chart above (chart 2) is also a daily chart of gold futures. It references the same instances when gold broke below $1700 per ounce on three occasions. However, it highlights those lows which indicate that on each occasion gold broke through $1700 and did not find any price support until approximately $1780 per ounce.

Given that during each instance different fundamental events resulted in gold's price decline. However, on each occasion, gold found support technical or otherwise at $1680.

As of 5:23 PM EDT gold futures basis, the most active August contract is currently trading up $0.70 or 0.04% and fixed at $1706.50. Like yesterday gold broke below $1700 and effectively closed above that price point. However, if past studies result in any real insight it seems more likely that gold prices will not hold at $1700 only based on technical indicators. There would have to be a fundamental event that resulted in a dynamic pivot or shift in the current bearish market sentiment that has been prevalent in gold. With the latest CPI and PPI report this week indicating that inflationary pressures have increased since last month and remain persistent, the possibility that the Federal Reserve will raise rates by a full percentage point at this month's FOMC meeting is real. This fact could certainly move gold lower.


By Gary Wagner

Contributing to kitco.com

Time to buy Gold and Silver on the dips


Tim Moseley

British Royal Mint sees gold bullion sales increase 8 in Q2 silver sales jump 47

British Royal Mint sees gold bullion sales increase 8% in Q2, silver sales jump 47%

The paper gold market has struggled to find consistent bullish momentum as prices dropped nearly 7% between April and June. However, the physical market saw solid growth, according to the latest report from the Royal Mint.

Thursday, the British mint said that sales of its gold bullion coins increased by 8% quarter-over-quarter. At the same time, silver bullion sales increased 47% compared to the sales in the first three months of 2022.

The mint added that it continues to see strong international sales, with specific demand growing among American consumers.

"Internationally, growth has also been seen in all three metals, with a 52% increase in the amount of gold ounces being sold, a 58% increase in silver ounces sold, and a 67% increase in platinum," the Royal Mint said in a statement.

"We are famous in the U.K. for making coins and bars from precious metals and have developed a strong international base of investors. It's encouraging to see such strong international sales, particularly from the U.S. and we look forward to expanding globally, providing a range of products to appeal to investors," added Andrew Dickey, director of precious metals at The Royal Mint.

The latest report from the British mint appears to be bucking the trend of slowing sales among significant mints. The U.S. Mint sold 315,000 ounces of gold during the second quarter, down 26% from the first quarter.

This is why gold is below $1,800 even as U.S. inflation hits a 40-year high at 9.1%
The U.S. Mint saw a demand drop sharply in June as it sold 52,000 ounces, according to the mint's revised data.

Meanwhile, the Perth Mint sold 244,737 ounces of gold in the second quarter, down 6% from 261,357 ounces sold in the first quarter.

Some analysts have said that the drop in bullion demand reflects nuances in the marketplace as higher premiums are pricing consumers out of the market. Premiums are high because of a supply and demand imbalance as bullion investors are holding on to the physical metal.

At the same time, analysts have said that the sharp drop in gold prices is expected to lead to an increase in physical demand. Thursday, gold prices dropped below $1,700 an ounce, hitting a nearly one-year low.

By Neils Christensen

For Kitco News

Time to buy Gold and Silver on the dips


Tim Moseley

Gold’s year-end target is 2050 and here’s why 17 price surge still possible Wells Fargo

Gold's year-end target is $2,050 and here's why 17% price surge still possible – Wells Fargo

The strong U.S. dollar has been hurting gold's price, dragging the precious metal down to 8.5-month lows as it steals its safe-haven appeal. But this is not a game-changer for gold, which can still end the year above $2,000 an ounce, according to Wells Fargo.

The U.S. dollar index rose to another 20-year high Tuesday, while the U.S. 10-year Treasury yield was at 2.921%. August gold futures were flat on the day, last trading at $1,731.60 an ounce after dropping below $1,725 overnight.

"The U.S. dollar has risen 12% since the start of the year. Almost half of that gain has come in the last month. Such big moves are quite rare, but when they do happen, commodity prices typically suffer. The reason is that most commodities are priced in U.S. dollars," Wells Fargo's real asset strategy head John LaForge said on Monday.

The broader commodities index has also suffered due to higher U.S. dollar and rising recession fears, hurting the demand outlook for industrial metals.

As the U.S. dollar gains, emerging market currencies drop, giving these countries less buying power.

"This loss of buying power can often negatively influence commodity demand and commodity prices," added LaForge. "Considering the strength in the U.S. dollar over the past month, it is not surprising that most commodity prices have been falling, gold especially."

Gold retreated 6% in June, primarily because of the U.S. dollar strength. The precious metal is one of the most sensitive commodities to the U.S. dollar price moves, according to LaForge.

Going forward, Wells Fargo is not expecting another significant move higher by the greenback, seeing it near its peak. However, for gold to move higher, it must create its own momentum.

LaForge's year-end gold price target is still at $2,050 an ounce, which he sees as reasonably achievable due to the recession narrative. He added that he would review his year-end targets soon if there is no movement.

"Gold needs its own surge of sorts — about 17% now — to hit our 2022 year-end target of $2,050 per ounce. For now, our year-end 2022 target remains unchanged, as 17% is doable. With recession around the corner, and gold being quite cheap versus most other commodities, investors may begin to buy. That said, we understand that time is running out, so we are reviewing our targets," he said.

By Anna Golubova

For Kitco News

Time to buy Gold and Silver on the dips


Tim Moseley

Is gold about to go mainstream?

Is gold about to go mainstream?

Every week Merrill Lynch publishes a Capital Market Outlook Letter. The letters provide market commentary, research and analysis, and the occasional investment idea. Merrill Lynch (together with parent Bank of America) is the third largest brokerage firm, managing over $3 Trillion in client assets. When a firm of that size speaks up, you should listen.

Starting around March of this year, they disclosed an investment thesis called FAANG 2.0. It's a fascinating idea and gold plays a prominent role. Let's unpack it.

Transitioning from FAANG 1.0 to FAANG 2.0

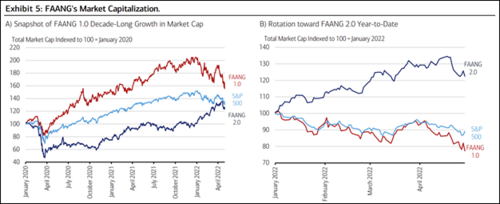
The original FAANG acronym described the high-growth, tech-centric companies that accounted for an outsized portion of returns over the last decade, and then catapulted even higher once the pandemic hit. FAANG 1.0 included:

Facebook – Apple – Amazon – Netflix – Google

And yet, these companies have experienced meaningful price declines year-to-date.

Merrill has been chronicling the "great rotation" out of FAANG 1.0 and into FAANG 2.0.

What's FAANG 2.0?

If FAANG 1.0 are the new kids on the block, then FAANG 2.0 is the old guard. They include:

Fuels – Aerospace – Agriculture – Nuclear/Renewables – Gold and Metals/Minerals

The reasons to favor FAANG 2.0 in today's market are intuitive. Let's explore a few of the salient points.

Why FAANG 2.0?

Geopolitical tensions

The ongoing war between Russia and Ukraine will drive demand for fuels, agriculture, energy and other "hard assets" such as gold and metals/minerals. It remains unclear how the conflict will resolve and whether it will escalate further. Merrill notes that "gold is now the preferred asset of central banks" in the face of such uncertainty.

Inflationary pressures

They're likely to persist longer than previously thought. And while the focus is typically on what you pay at the pump, world food prices are at all time record highs. For anyone following Keith's work on inflation, it's unlikely the items he highlights (trade war, tariffs, lockdown whiplash, regulatory compliance, and green energy policy) are going to be resolved any time soon.

Supply and Demand Imbalance

There seems to be two primary reasons behind the supply/demand imbalance driving FAANG 2.0. One is the leftover supply chain disruptions from the pandemic. Equipment shortages, labor dislocations, logistics bottlenecks, and higher input costs arestill keeping products from getting to market. Two is simply greater demand than supply for these materials. For example, increased defense spending is driving greater demand for fuels and aerospace. Germany is doubling its annual budget. NATO is requiring all participating countries to devote at least 2% of GDP to defense spending by 2024. Likewise demand for energy alternatives (nuclear and renewables), and EV's is exploding, creating intense demand for the metals/minerals needed to scale production.

This paragraph from the May 2 letter sums up the case for FAANG 2.0 nicely.

In a matter of months, we have gone from a pandemic to Putin; infections to inflation; Big Data to Big Oil; zoom to zinc; masks to mascara; E-commerce to electric vehicles; jabs to javelins; swabs to sanctions; Webex to weddings; boosters to bombs; Non-fungible tokens (NFTs) to liquefied natural gas (LNG); Centers for Disease Control (CDC) to North Atlantic Treaty Organization (NATO); work-from home to work-from-office; the cloud to cobalt; and lite assets to hard assets.

Gold's Role in FAANG 2.0

Gold plays a prominent role in Merrill's FAANG 2.0 investing framework. Specifically, they cite investor concerns over inflation and war as reasons for why the "safe-haven" asset should enjoy consistent demand over 2022. Gold has posted strong YTD performance relative to other assets (gold is up about 1% compared to an average of -41% for the FAANG 1.0 crowd).

Why is gold considered a safe-haven asset?

The answer is simple but profound.

Gold is solvency you can hold in your hand.

In a world that poses significant risks of default, whether from inflationary pressures on businesses, aggravated by higher interest rates, or an escalation between Russia and NATO, gold is the asset you own when you don't want to take that risk.

Merrill's endorsement of gold as a major part of its FAANG 2.0 investment thesis could be a significant driver for gold going more mainstream. Despite many large asset managers paying lip service to the importance of owning gold in a diversified portfolio, and the fact that the benefits of owning gold have been well documented, it still remains one of the most under-owned assets.

There's another way gold could go mainstream though; it's called gold 2.0.

Transitioning from Gold 1.0 to Gold 2.0
 

What's gold 2.0?

It's gold with yield, specifically a Yield in Gold, Paid in Gold®. We've said it over and over again, everyone should own some physical gold as an insurance against the solvency risks outlined above. But insurance only protects wealth, it cannot grow your wealth. Monetary Metals offers gold with yield—gold 2.0—which protects and grows your wealth.

You can own physical gold, in secure vaults, outside the financial system, with the option of earning 2% to 3% interest, paid in more gold (silver too).

Whether from increased safe-haven demand, or greater demand for gold with yield, the 2020's could be the decade that gold breaks back into the mainstream in a big way.

By Keith Weiner

Contributing to kitco.com

Time to buy Gold and Silver on the dips

Tim Moseley

June headline inflation to exceed 86 the annual inflation rate in May

June headline inflation to exceed 8.6%, the annual inflation rate in May

Economists, analysts, and market participants are laser-focused on the Labor Department's CPI (Consumer Price Index) report for June which will be released on Wednesday, July 13. The advanced forecasts released have a common theme or consensus and that is that inflation will continue to run exceedingly hot. Expectations are that headline inflation which includes changes in food and energy costs rose 1.4% compared to the previous month and come in at 8.7% YoY.

"The strong price increase of this year accelerated further in June 2022 and is expected to have climbed to 8.7 %. This is shown by an advanced estimate of Statistics Austria. This means that the inflation rate has risen to its highest level since September 1975. In the meantime, inflation has picked up speed in almost all areas. In addition to recent increases in fuel and heating oil prices, we also see significant increases in restaurant and food prices", according to Statistics Austria Director-General Tobias Thomas.

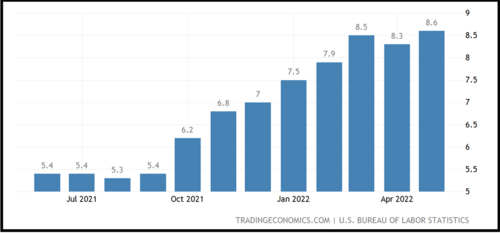
U.S. News today reported, "On Wednesday, the Labor Department will report the consumer price index for June, with forecasts that it will top the 8.6% rate for annual inflation recorded in May. A run-up in energy prices last month that has since abated is likely to make for an ugly headline number."

CNBC also reported, "The June consumer price index on Wednesday is expected to show headline inflation, including food and energy, rising above May's 8.6% level."

The consensus among different new services is overwhelmingly anticipating that inflation will continue to grow. The CPI report on Wednesday coupled with last week's jobs report will almost certainly result in another aggressive rate hike of 75 basis points at the July FOMC meeting which will convene at the end of this month.

The overwhelming majority of economists and analysts are anticipating that the Federal Reserve will announce and enact the fourth rate hike this year with consecutive interest rate hikes that began in March.

The Federal Reserve raised interest rates for the first time since 2018 in March. Before the first-rate hike, the fed funds rate was at ¼%. The Fed raised interest rates by 25 basis points at the March FOMC meeting, 50 basis points in May, and 75 basis points in June. It is now expected that they will raise interest rates by 75 basis points in July. The July FOMC meeting will begin on the 26th and conclude on the 27th of this month.

This matches the probability forecast by CME's FedWatch tool, this probability gauge is indicating that there is a 93% probability that the Federal Reserve will raise rates once again by 75 basis points this month.

The net result of the current inflation outlook has pressured U.S. equities lower, taking the U.S. dollar index higher and continuing to pressure gold prices lower on the first trading day of this week.

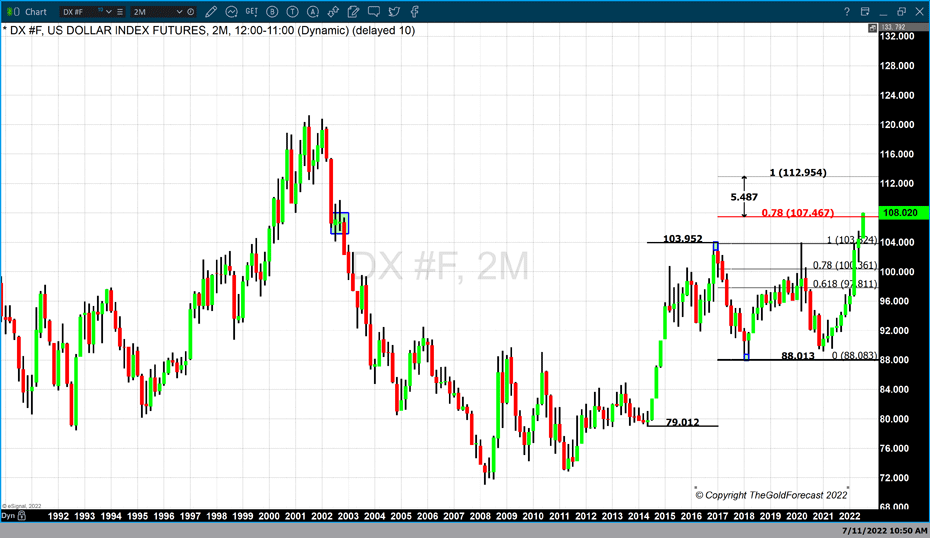
As of 4:45 PM EDT, the dollar has gained 1.11% or a total of 1.184 points, and is fixed at 108.005. Our studies indicate that there is no major technical resistance until the dollar index reaches 113. This assessment was created by using a Fibonacci extension from the lows of 79.012 in May 2014 up to the high of 103.952 during the first quarter of 2017.

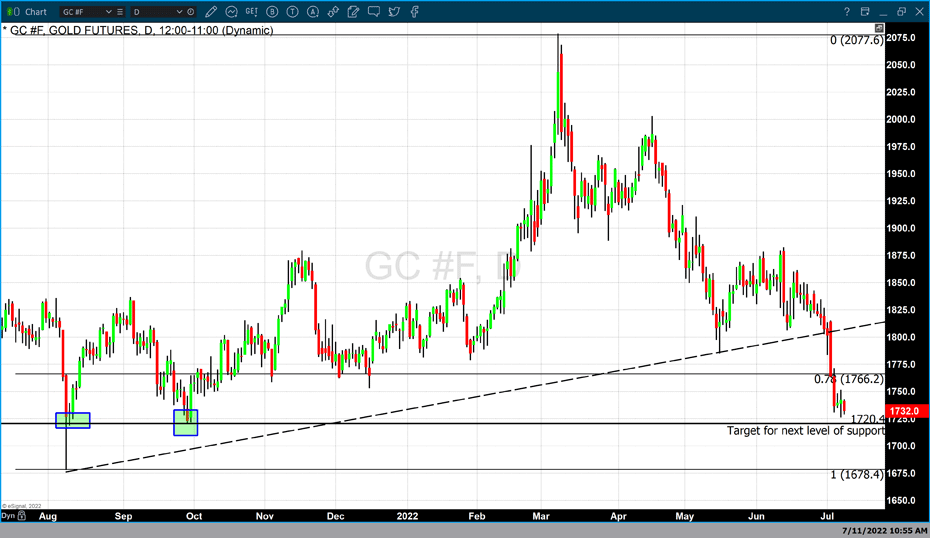
The widely anticipated 75 basis points rate hike by the Federal Reserve has continued to pressure gold pricing lower. The most active August 2022 futures contract is currently fixed at $1731.90 after factoring in today's decline of $10.40. Based on our technical studies the first level of potential support comes in at $1720 with major support at $1680.
 

By Gary Wagner

Contributing to kitco.com

Time to buy Gold and Silver on the dips


Tim Moseley

Gold prices may see a short-term bounce next week but sentiment remains depressed

Gold prices may see a short-term bounce next week, but sentiment remains depressed

The gold market is seeing its worst weekly performance in two months as its 4% decline matches the same move seen in May.

Mixed sentiment in the precious metal markets doesn't point to a significant recovery anytime soon, even if market analysts see the price action as significantly oversold, according to the latest Kitco News Weekly Gold Survey.

Gold struggled this week as investors expect the Federal Reserve to continue to aggressively raise interest rates to cool down rising inflation pressures. According to the CME FedWatch Tool, markets have all but completely priced in a 75-basis point move later this month.

According to some analysts, the U.S. central bank's aggressive stance has propelled the U.S. dollar to a 20-year high, which single handily drove gold prices to test long-term support at $1,730 an ounce.

Although there is some significant bearish sentiment in the marketplace, some analysts have said they are looking for a bounce in the near term.

"Gold is overall bearish, but approaching significant possible exhaustion levels below, which could trigger a bullish correction/trend," said Michael Moor, founder of Moor Analytics. "We have broken below multiple bearish formations, but are likely in the last structural stretch down from the highs."

Colin Cieszynski, chief market strategist at SIA Wealth Management, said that he also sees the potential for at least a short-term bounce in gold.

"The recent drawdown in the gold price has mainly been driven by a rally in the U.S. dollar, which has been getting overextended technically. With the RSI for XAUUSD getting oversold, gold could be due for a short-term trading bounce," he said. That being said, with so much capital moving into the U.S. looking for a defensive haven, gold could continue to struggle against the U.S. dollar."

Gold faces a difficult second half but it's not hopeless – World Gold Council
Cieszynski added that while gold could struggle against the U.S. dollar, it remains strong against other major global currencies.

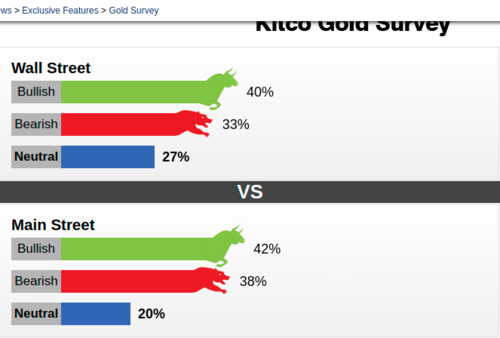
This week 15 Wall Street analysts participated in Kitco News' gold survey. Among the participants, six analysts, or 40%, we're bullish on gold in the near term. At the same time, five analysts, or 33%, were bearish on gold, and four analysts, or 27%, were neutral on the precious metal next week.

Meanwhile, 484 votes were cast in online Main Street polls. Of these, 204 respondents, or 42%, looked for gold to rise next week. Another 183, or 38%, said lower, while 97 voters, or 20%, were neutral in the near term.

Although sentiment among retail investors remains low, the participation rate is also low, indicating very little attention to the precious metal within this volatile environment.

Although gold has room to move lower in the near term, some analysts have said there is still solid support in the marketplace.

Phillip Streible, chief market strategist at Blue Line Futures, said that the selloff could be seen as a capitulation move as many complacent long positions have left the market.

"A lot of fat has been trimmed this week and we don't think there are that many sellers in the marketplace. I don't think we see prices fall much below $1,700," he said.

However, other analysts remain significantly bearish even if there is a break in the selling pressure.

"The big picture for gold is still bearish, but I am finding it tough to jump back in," he said. "I'm looking for $1650, which would be the neckline in a big double top that projects back toward $1200," he said.

For many analysts, if gold is going to regain its luster, the market needs to see a shift in U.S. monetary policy. The Federal Reserve's expected 75-basis point move remains a challenging headwind for gold.

Some analysts and economists noted that the latest employment report, which showed that the economy created 372,000 jobs last month, has solidified the rate cut. The market is seeing some hope that the U.S. central bank can engineer a soft landing as it continues to raise interest rates.

By Neils Christensen

For Kitco News

Time to buy Gold and Silver on the dips


Tim Moseley