Gold Price to New Heights ?

Gold Price to New Heights ?

Since its low in November 2022, the price of gold in dollars has climbed nearly +15% (compared to +4.5% in euros). The rising cost of gold production and the declining profitability of mining companies largely explain this movement. As early as November 2022, we were insisting on the strong probability of an effective gold reversal in 2023. This movement has now been confirmed. But will this rise be enough to drive new highs?

Throughout this publication, we will see that despite the slight drop in the dollar price of gold in 2022, demand is clearly on the rise. At the same time, production costs are rising and mining companies are less profitable. This context largely explains the strong rebound of gold. But what is most impressive is the appetite of central banks for gold, whose demand has increased at a rate not seen since 1967… Behind the structural changes in the market, gold seems to hide a geopolitical confrontation of considerable magnitude.

Strong increase in demand for gold in 2022

Contrary to what many had suggested, demand for gold was boosted considerably in 2022. Demand for the physical metal increased by 18% between 2021 and 2022, while supply increased by only 2%. The stability of the gold price in 2022 once again shows the lack of a link between the price and actual demand.

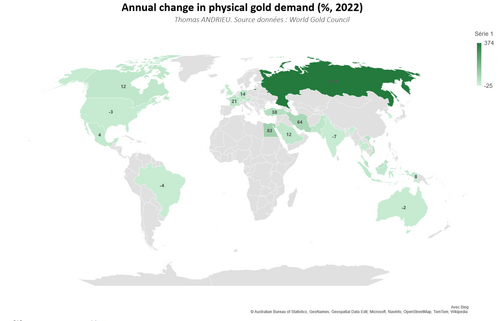
We should also note the particular case of Russia. The demand for coins and bars in Russia jumped by 374% in 2022 to 25 tons! This is a very significant increase for the reasons we know. In France, the increase in demand for coins and bars is still 21%, or 14% in Germany. The chart shows a clear interest in gold in European countries, mainly due to the fall of the euro in 2022. But the interest in gold is even stronger in the Middle East and Russia, driven by a desire for monetary independence.

Central banks are massively buying gold

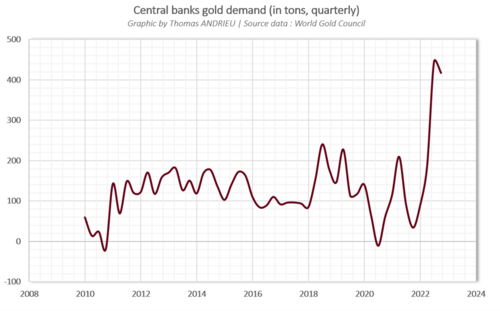
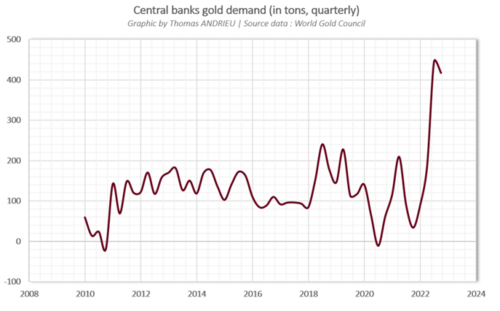
One thing that catches our attention is the sudden and massive revival of interest in the yellow metal by central banks. Central bank demand for gold jumped 152% between 2021 and 2022! This is simply the largest amount of gold ever purchased by central banks in one year in decades. The equivalent of 1,135 tons.

These massive purchases are questionable, as they run counter to the trend observed in recent years. In 2019 and 2020, central bank demand had fallen by 7.7% and 5.8%, respectively. Central banks' purchases are taking place against a backdrop of balance sheet reduction, which seems contradictory. Turkey has thus increased its gold reserves by 147 tons in 2022, followed by 62 tons for China, and 44 tons for Egypt.

According to the World Economic Forum, the pace of gold accumulation by central banks is unprecedented since 1967! In a WEF article published on November 10, 2022, the WEF states that: “Gold is regarded as an effective inflation hedge, although some analysts believe this to be true only over extremely long time horizons stretching over a century or more.”

Gold is primarily considered in the same way as foreign exchange reserves. In order for the balance of payments between countries to be balanced, central banks must change their reserves. Foreign exchange reserves thus tend to decrease when a country experiences either capital outflows, a deterioration of its trade balance, or a decrease in prices. It is understandable why, in an inflationary context, the demand for foreign exchange reserves increases, and with it, the demand for gold. The case of Turkey, which has seen inflation rise to over 80%, is revealing. Faced with a rising dollar, many central banks are buying gold to ensure liquidity on the international scene. The real interest of gold for central banks is, above all, to guarantee a source of confidence and independence.

Time to Buy Gold and Silver

Tim Moseley

Gold price to take direction from Powell’s testimony US jobs report next week

Gold price to take direction from Powell's testimony, U.S. jobs report next week

After five consecutive weeks of losses, the gold market posted its first weekly gain. Analysts say the precious metal will now take direction from the upcoming Federal Reserve Chair Jerome Powell's testimony and the February employment report.

After testing the lows at $1,810 an ounce, gold bounced back to the mid-$1,800s range. At the time of writing, April Comex gold futures were at $1,852.70 an ounce, up $35 on the week.

"I am impressed with how gold performed, especially when you look at yields, with the 10-years above 4%," OANDA senior market analyst Edward Moya told Kitco News. "It will be pretty wild next week because of the hawkish Powell testimony and U.S. payrolls data. We might see some gold weakness initially, but then some strength after payrolls."

On Tuesday, Powell will testify on the U.S. central bank's semiannual monetary policy report to the Senate Banking Committee. This will be followed by his testimony on the same topics to the House Financial Services Committee on Wednesday.

Markets will also digest the latest U.S. nonfarm payrolls report from February, with consensus calls projecting 200,000 new positions and the unemployment rate remaining at 3.4%.

"The February employment report and Fed Chair Jerome Powell's testimony to Congress next week should give a clearer indication of whether recent talk of interest rates going 'higher for longer' is justified," said Capital Economics' deputy chief U.S. economist Andrew Hunter.

Powell is likely to remain aggressive in his language, Moya noted. "He can't change that right now. It could weigh gold down in the first half of the week," he said. "The message 'higher for longer' will be firmly implemented."

One development that could move gold prices higher is the downward revision to January's strong employment report.

"We might have a significant downward revision. January's 517,000 positions could get revised. We're likely to see a sharper slowdown in hiring. The February number could also come in below the consensus," Moya said.

Gold's strong rally at the start of the year was reversed when the markets received the January employment news, RJO Futures senior market strategist Frank Cholly told Kitco News.

"Strong employment report was followed up with inflationary news — CPI, PPI, and retail sales," Cholly added. "All this data indicated that the Fed has to continue to raise rates, and gold fell."

The gold market continued to trend downward until it hit the $1,810s level, which coincided with the metal's 200-day moving average, Cholly pointed out. At that point, gold got a bounce.

"The market might do some consolidation here and wait for direction. But we probably found a bottom. There is value in gold between the $1,800-$1,825 range," Cholly noted.

Once gold can close above $1,860, more buying would kick in. And above $1,880 an ounce, Cholly sees the $1,900 level at play again.

"It will depend on how the data comes out over the next two weeks. The employment number and then the CPI and PPI the week after that. If we continue to see that the Fed will have to be aggressive with rate hikes, gold will re-test last week's lows," he said.

Moya added that gold's resistance is $1,880, and support is $1,820 an ounce.

In the short-term, gold remains very data-depended — just like the Fed. "It was all about payrolls last month. This time, the nonfarm payrolls, the CPI, and PPI will also be critical for the direction of interest rates and precious metals. If we are getting such good yields on fixed incomes, it is hard for gold to move higher," Cholly stated.
 

Next week's data

Monday: U.S. factory orders

Tuesday: Fed Chair Powell testifie

Wednesday: ADP nonfarm employment, Fed Chair Powell testifies, BoC rate decision

Thursday: U.S. jobless claims,

Friday: U.S. nonfarm payrolls

By Anna Golubova

For Kitco News

Time to Buy Gold and Silver

Tim Moseley

GoldSilver – The next bull wave begins

Gold/Silver -he next bull wave begins

It was a turning point for Precious Metals this week as Gold, Platinum, and Silver all rose after six straight down weeks. The rally came on the heels of a stronger U.S. Dollar and another cycle high in Treasury Yields. The physical buying this year has been robust, and once the Fed concludes hiking rates, news of the pivot will spark an additional buying frenzy. I expect Gold to take a forward-looking approach as it begins its recovery while the long end of U.S. rates makes another lower high.

Daily Gold Chart

While the upside momentum has been strong, it will take a move back through $1891 to neutralize the downward trend and, ultimately, a move through $1900 to get the bulls back on track. $1785 is where the 200 day moving average comes in and acts as long-term support. To further help you develop a trading plan, I went back through 20 years of my trading strategies to create a Free New "5-Step Technical Analysis Guide to Gold that can easily apply to Silver." The guide will provide you with all the Technical analysis steps to create an actionable plan used as a foundation for entering and exiting the market. You can request yours here: 5-Step Technical Analysis Guide to Silver.

Our Strategy

By systematically purchasing regular intervals of the 10-ounce Gold contract or 1000-ounce Silver contract, you can layer in over time and preposition for the next rally. One example with a $25,000 account size would be to focus on the December 2023 10-ounce Gold contract and use a dollar-cost average approach by purchasing 10 ounces of Gold at 1850/oz, 10 oz at 1800, and 10 oz at 1750 with a year-end target of $2100/oz.

If filled on all three contracts, your average price will be $1800/oz; therefore, every dollar move Gold makes on the three contracts will be $30 since you control 30 ounces. If the $2100/oz price objective is achieved by year-end, this will result in a gain of approximately $9,000 (30 oz times $300 rise). Traders should also consider proper risk management while using a dollar-cost averaging approach, such as a hard stop on three contracts at $1700. If that were to occur under this scenario, it would likely result in a loss of $3,000. If you have never traded futures or commodities or would like to learn more about taking delivery of Silver, I just completed a new educational guide that answers all your questions on transferring your current investing skills into trading "real assets," such as the 1000 oz Silver futures contract. You can request yours here: Trade Metals, Transition your Experience Book.

By Phillip Streible

Contributing to kitco.com

Time to Buy Gold and Silver

Tim Moseley

Rising USDX US Treasury yields put price pressure on gold silver

Rising USDX, U.S. Treasury yields put price pressure on gold, silver

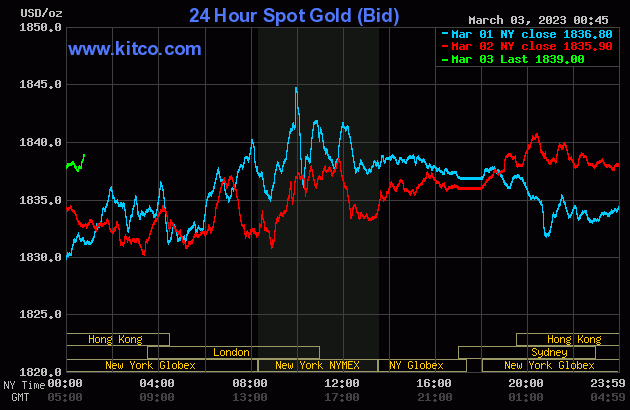
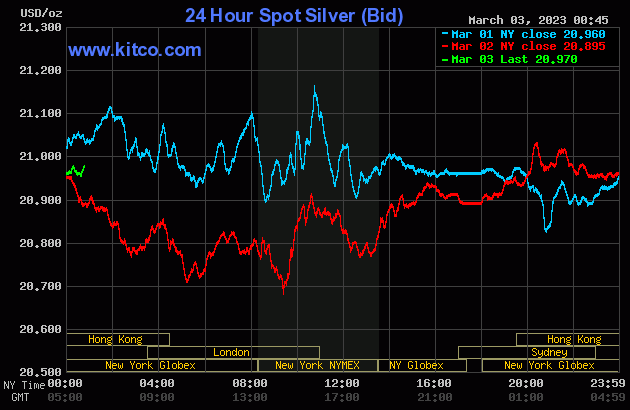
Gold and silver prices are weaker in early U.S. trading Thursday, as rising U.S. Treasury yields and an appreciating U.S. dollar on the foreign exchange market are bearish outside market forces working against the metals market bulls on this day. April gold was last down $7.50 at $1,837.40 and May silver was down $0.20 at $20.895.

Global stock markets were mixed overnight. U.S. stock indexes are pointed toward mixed openings when the New York day session begins. A feature in the marketplace recently has been rising U.S. Treasury yields. The yield on the benchmark U.S. 10-year Treasury note is presently fetching 4.020%. The yield is the highest since last November. Traders and investors worried about a still-hawkish Federal Reserve keeping interest rates higher for longer in order to successfully tamp down problematic price inflation. However, that means the Fed clamping down on U.S. economic growth to squelch consumer and commercial demand.

In overnight news, the Euro zone February consumer price index came in at up 8.5%, year-on-year, compared to up 8.6% in January and a forecast for up 8.2% in the February report. It’s apparent the European Central Bank still has more work to do to defeat high inflation in the Euro zone.

The key outside markets this morning see the U.S. dollar index higher. Nymex crude oil futures prices are firmer and trading around $78.25 a barrel. Oil prices have rallied recently on hopes for better energy demand from China, the world’s second-largest economy, as that nation has abandoned its Covid restrictions.

U.S. economic data due for release Thursday includes the weekly jobless claims report, revised productivity and costs, and the monthly chain store sales index.

Technically, the gold futures bears have the slight overall near-term technical advantage. Prices are still in a downtrend on the daily bar chart, but just barely. Bulls’ next upside price objective is to produce a close in April futures above solid resistance at $1,881.60. Bears' next near-term downside price objective is pushing futures prices below solid technical support at $1,800.00. First resistance is seen at this week’s high of $1.852.50 and then at last week’s high of $1,856.40. First support is seen at Wednesday’s low of $1,829.60 and then at $1,820.00. Wyckoff's Market Rating: 4.5

The silver bears have the overall near-term technical advantage. Prices are in a steep downtrend on the daily bar chart. Silver bulls' next upside price objective is closing May futures prices above solid technical resistance at $22.25. The next downside price objective for the bears is closing prices below solid support at $19.00. First resistance is seen at this week’s high of $21.285 and then at $21.52. Next support is seen at the overnight low of $20.78 and then at this week’s low of $20.505. Wyckoff's Market Rating: 4.0.

By Jim Wyckoff

For Kitco News

Time to Buy Gold and Silver

Tim Moseley

Gold and silver are tactical plays ahead of data storm Powell’s Senate testimony – Pepperstone

Gold and silver are tactical plays ahead of data storm, Powell's Senate testimony – Pepperstone

Precious metals could be a tactical play ahead of a data storm in the next two weeks, including Federal Reserve Chair Jerome Powell's testimony before the U.S. Senate, said Pepperstone's head of research Chris Weston.

It is getting harder to shock markets with higher-than-expected inflation numbers, and that reaction function is important for the gold market.

"The failure of the EUR … to be overly influenced by the above consensus French and Spanish CPI data suggests the market is becoming harder to shock by inflation reads. The risk-reward is shifting – the gold market will be watching this closely," said Weston Wednesday. "Gold and silver have come up on the radar, and both could be a tactical play as we eye a data storm brewing over the next two weeks."

The big market movers coming up are the U.S. employment (March 10) and inflation (March 14) reports. But all of this will be preceded by Powell's semiannual testimony before the U.S. Senate's banking committee on the Fed's monetary policy report, scheduled for March 7.

"That could spark some market volatility, but trading a speech is more problematic, as we're fighting algo's who are programmed to rapidly react to words," Weston noted.

This means traders need to gear up for higher intraday moves in the lead-up to the Fed's March monetary policy meeting, scheduled for March 22. "The market will tweak positioning into these defining events," Weston said.

Market consensus calls are projecting nonfarm payrolls to have added 200,000 new positions in February after the 517,000-shocker reported in January. The unemployment rate is estimated to tick up to 3.5% from 3.4%.

Weston forecasts the U.S. inflation (CPI) to come between 6% and 5.5% in February, a decent deceleration from the 6.4% reported in January.

"With gold so heavily inversely correlated to both nominal and real U.S. bond yields, I question if the market looks to pair back on their rates exposure into this data – a factor which could boost the gold price," Weston pointed out.

After February's $100 selloff, the gold market narrowly missed a bearish outside monthly reversal, according to Pepperstone. At the time of writing, April Comex gold futures were last at $1,845.10, up 0.46% on the day.

"Is this a sign of better demand and the sellers failing to push the price to $1,800? Perhaps – but it's early, and the price action needs work to really convince – adopting a more momentum approach," Weston said.

Pepperstone advises putting in buy-stop orders above Tuesday's high of $1,831.15 and positioning for the price to keep pushing higher.

"It may be that we see price rollover and re-test Tuesday's lows," Weston said. "As with any momentum and trend strategy, we get many false breaks, and the strike ratio can be far lower than, say, mean reversion, so it's important to cut losses early and extract as much out of the trade as possible."

By Anna Golubova

For Kitco News

Time to Buy Gold and Silver

Tim Moseley

Gold trades higher for a second consecutive day overcoming dollar strength

Gold trades higher for a second consecutive day overcoming dollar strength

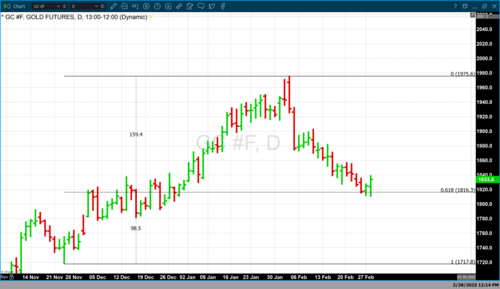
After four consecutive days in gold traded to a lower high, a lower low, and a lower close than the previous day, traders have witnessed a pivot that began yesterday. Gold futures traded to the lowest value today hitting an intraday low of $1810.80. This follows yesterday’s prior lowest low of $1812. However, both yesterday and today gold closed higher when compared to the previous day and higher when compared to its opening price.

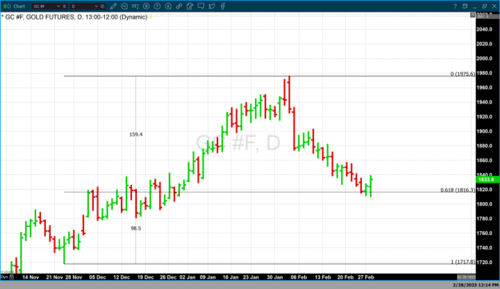
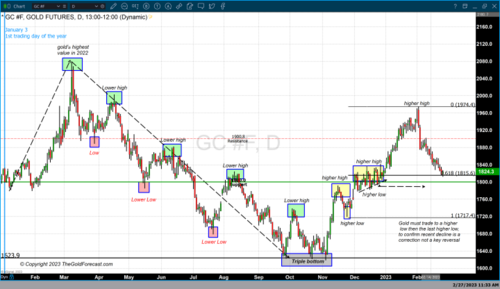
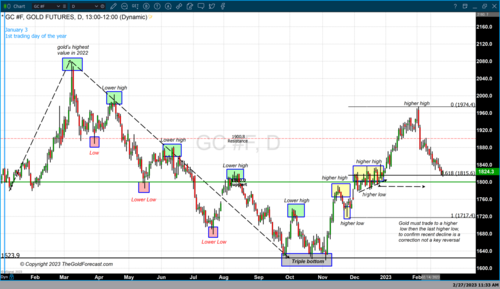
While today’s green candle with a higher high does not on its own confirm a conclusion to the correction that began in the middle of January when gold prices hit their highest value ($1974) of the calendar year, this is how a reversal would look if gold continues to move higher in the upcoming days. In yesterday’s video report, we talked about the importance of $1815 as a key price point to look at for potential support.

This was based on a Fibonacci retracement of 61.8% which is a deep but acceptable correction. The data set used for the Fibonacci retracement covers the entire price area from the most recent leg of the rally. This rally begins at $1719 the low that completed a mild correction during the third week of November, to this year’s high at $1974 (the conclusion of the last rally). What followed was a quick and brutal correction from $1974 down to today’s low at $1810.80.

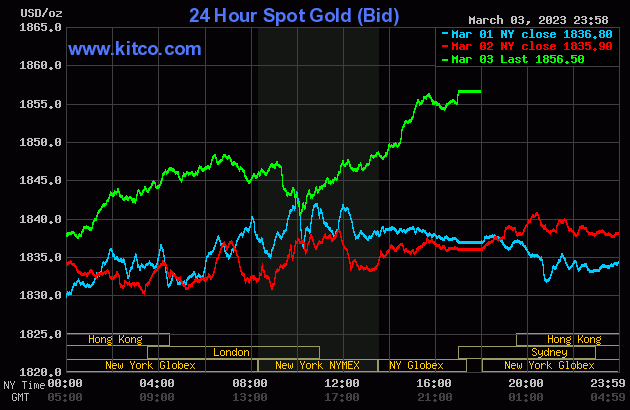
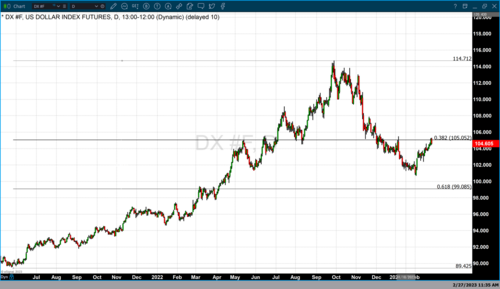
As of 5:00 PM EST gold futures basis the most active April contract is currently up $8.90 or 0.49% and fixed at $1833.80. Today’s gains in gold overcame dollar strength. The dollar is currently up 0.32 points or 0.31% with the dollar index fixed at 104.945.

It does appear as though the month will conclude with two moderate days of gains. That being said, gold’s performance during February 2023 was atrocious. Gold’s value declined by approximately 5% and will go in the record books as the worst monthly decline since June 2021. This month’s decline was largely based on the conviction that the Federal Reserve will continue its extremely hawkish monetary policy including more interest rate hikes and keeping those elevated levels for a longer time.

The latest kink in the Federal Reserve’s armor was that the most recent inflation reports came in unexpectedly higher rather than showing a continued decline in inflationary pressure. When compared to the previous month, the core PCE rose by 0.6% in January, bringing the year-over-year PCE to 5.382%.

The Federal Reserve will hold its next FOMC meeting on March 22-23. Before that meeting, there will be critical reports that will help shape the next rate hike Implemented by the Federal Reserve.

On March 10 the US Labor Department will release its latest jobs report for February. Then on March 14, the government will release the CPI inflation index for January. Collectively, these two reports will be the most current data used by the Federal Reserve to determine the amount of the next rate hike.

According to the CME’s FedWatch, there is a 73.8% probability that the Fed will raise rates by 25 BPS and a 26.2% that the Fed will be more aggressive with a 50 BPS rate hike.

By Gary Wagner

Contributing to kitco.com

Time to Buy Gold and Silver

Tim Moseley

The Critical Distinctions of CBDCs and Cryptocurrencies You Need To Know

The Critical Distinctions of CBDCs and Cryptocurrencies You Need To Know


The subject of Central Bank Digital Currencies (CBDCs) is more pervasive than ever, with governments worldwide rushing to roll out their CBDCs, advocating that central bank digital currencies are like cryptocurrencies, only better. Citizens all over the world know this statement is false and vehemently oppose this new monetary system by lodging petitions and protests. However, a substantial proportion of society doesn’t recognize or even comprehend this age of digital technology. 

Today we’ll look at the difference between CBDCs and cryptocurrency and how they cannot be compared. That’s because one system will be used to enslave us, and the other will give us freedom and sovereignty.

 
When Did It All Start?

The two financial technologies are rooted in various digital currency initiatives, mostly coming into existence in the 1990s. The most significant difference is the digital currencies of that time were created to optimize payments primarily in a domestic setting. In other words, these digital currencies were intended to optimize the existing financial system by integrating with it.

An example is Finland’s eMoney system, Avant, in the 1990s, which was closely connected to its national currency and banking infrastructure. While some consider Finland’s eMoney to be the first CBDC, it is generally believed that the first actual CBDC to be released was the Bahamian Sand Dollar in October 2020. Although now, almost every country is actively working on a CBDC of some kind. 

In contrast to CBDCs, cryptocurrencies were initially created to replicate or even replace the existing financial system. In many cases, this meant they were internationally available to anyone with an internet connection. Two examples are David Chaum’s Ecash in the 1980s and Adam Back’s Hashcash in the 1990s.  Today, Adam is the CEO of Blockstream, one of the largest Bitcoin-related companies.

Then along came Bitcoin in 2008, boasted as the first cryptocurrency, created by a pseudonymous individual or group called Satoshi Nakamoto.  The first Bitcoin block contained a hidden message: "Chancellor on brink of second bailout for banks.” This was the headline of The Times newspaper on January 3rd, 2009, the same day Bitcoin went live.
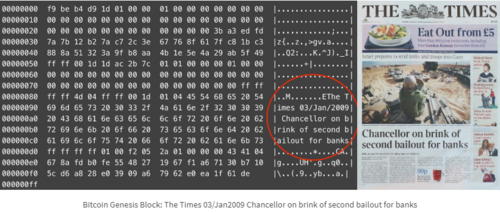
Image source: https://bitcoinbriefly.com/21-million-bitcoin/

Bitcoin’s explicit intention is to replace the current financial system, and every prominent cryptocurrency that has come into being since that time shares this ethos. Whereas Bitcoin was created in response to the 2008 financial crisis, the CBDC was essentially created in response to cryptocurrencies. More to the point, CBDCs were created in response to alternative digital currencies of all kinds, be they public or private. 

For example, China began developing its digital Yuan in response to the country's rapid growth of financial technology companies during the 2010s. Similarly, the United States started developing its digital dollar in response to Facebook's digital currency, Libra, which was revealed in 2019 but never made it off the ground. On the other hand, Indonesia began developing its digital Rupiah in response to cryptocurrencies after the last bull run in 2017. 
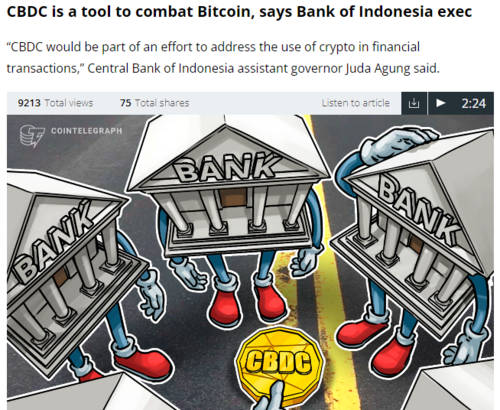

Image source: Cointelegraph

Meanwhile, the Marshall Islands began developing its digital currency, dubbed the Marshallese sovereign, in response to developing CBDCs in other countries. Nevertheless, the common theme is centralized financial system control. This ultimately makes today's CBDCs different from their predecessors, which focused on payment optimization rather than centralized control. 

As such, we can define CBDCs as a type of digital currency centrally controlled by the government and requiring permission. Alternatively, we can define cryptocurrencies as virtual currency that is not controlled by anyone and does not require permission. 

CBDC’s and Cryptocurrency’s Underlying Implementations

Understanding how CBDCs and cryptocurrencies work under the hood is essential, starting with three definitions for the often misunderstood terms; Blockchain, Distributed Database (DDB), and Distributed Ledger technology. (DLT)

A blockchain is a specific type of distributed ledger technology. Notably, all Blockchains are distributed ledgers (DL), but not all distributed ledgers are blockchains. Permissionless or public blockchains are decentralized, meaning a single individual or institution does not control them. Instead, they are controlled by a vast network of unrelated individuals and institutions, so there's no single point of failure.

Distributed databases store data in a shared network rather than at a centralized location. This solution is for businesses that need to process huge amounts of structured and unstructured data, which could scale across networks. Consensus mechanisms such as Paxos or Raft control read/write permissions and establish secure communication channels among participants. However, these protocols assume that each participant cooperates in good faith, which limits their application to private networks under a centralized authority. 

Distributed Ledgers (DL) are like DDB protocols in that they maintain a consensus about the existence and status of a shared set of facts but do not rely on this assumption of good faith. They achieve this by leveraging strong cryptography to decentralize authority. They are different from generic distributed databases in two fundamental ways:

1. The control of the read/write access is genuinely decentralized, whereas it remains logically centralized for distributed databases.

2. Data integrity can be assured in adversarial environments without employing trusted third parties, whereas distributed databases rely on trusted administrators.
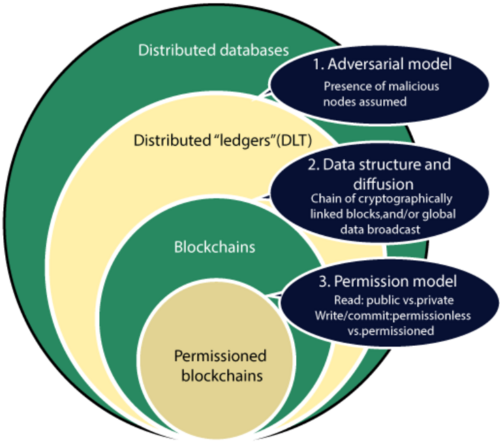

Image source: Blockchain Tutorial 

These terms are good to know because many countries claim their CBDCs will use a blockchain. However, countries claiming their CBDCs will use a Blockchain will use a distributed database because the Central Bank will centrally control it. It's possible that the officials making these statements don't know the difference or don't care to make the distinction. 

Some argue that the purpose of using the term ‘blockchain’ or ‘inspired by Bitcoin’ is to intentionally mislead the public into thinking the CBDC is just like a cryptocurrency. Although, it’s worth mentioning that a few regions seem to be planning to launch their CBDCs on cryptocurrency blockchains, such as the Marshall Islands, which has selected Algorand technology. But even then, it's likely that the central bank will still maintain total control of its CBDC because it would be issued as a token. 

What Is The Difference Between Coins And Tokens?

As we continue to be enlightened by this technology, the two different cryptocurrencies are often misrepresented, so here are the definitions of crypto coins and tokens.   

A cryptocurrency coin is native to its blockchain and is given as a reward to the miners (basically just powerful computers) that process transactions. Cryptocurrency coins also pay transaction fees on a cryptocurrency’s blockchain. For example, BTC is given as a reward to cryptocurrency miners that process transactions on the Bitcoin blockchain. These cryptocurrency miners also earned the transaction fees paid in BTC.

Conversely, a cryptocurrency token is a customizable digital asset that exists on a cryptocurrency’s blockchain. Unlike coins, which directly represent a proposed medium of exchange, crypto tokens represent an asset. These tokens can be held for value, traded, and staked to earn interest. Unlike coins, tokens can choose not to be bound to a single blockchain, gaining flexibility and becoming easier to trade.

Tokens are used with decentralized applications (DApps) and are usually built on top of an existing blockchain. One example is Markethive’s Hivecoin, currently being integrated into the Solana Blockchain.  Cryptocurrency tokens can be used for all sorts of things and have led to some exciting applications, such as decentralized finance (DeFi), non-fungible tokens (NFTs), and emerging crypto ecosystems in social media and marketing.   

The key takeaway here is that the creator of a cryptocurrency token can give themselves total control over the transfers of that token, the supply of that token, etc. Some stablecoins are cryptocurrency tokens that mirror the price of fiat currencies, primarily the US dollar. So, in the case of centralized stablecoins that are centrally controlled by the companies which issued them, any CBDCs issued as cryptocurrency tokens will likely work similarly. 

The Economics Of CBDCs And Cryptocurrencies

For context, let’s look at the economics of the current financial system. Central banks worldwide are tasked with encouraging economic growth while keeping inflation under control. They do this by raising and lowering interest rates. When interest rates are low, borrowing becomes cheap, making saving less attractive. This incentivizes individuals and institutions to spend rather than save, which increases economic growth. However, it also increases inflation as more money is circulated with low-interest rates.

When interest rates are high, borrowing becomes expensive, making saving more attractive. This incentivizes individuals and institutions to save rather than spend, which lowers economic growth. However, it also decreases inflation as there is less money in circulation when Interest rates are high.
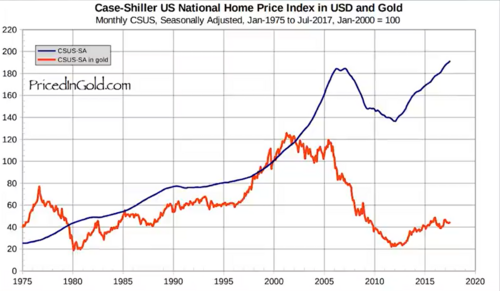

Image source: PricedInGold.com

The big problem with this economic model is that money can easily be created, but taking it out of circulation is much more challenging. This inevitably leads to inflation in the long term. Long-term inflation wasn't a problem because fiat currencies were backed by gold. This limits how much money could be created in an economy because more gold had to be acquired to issue more money. 

However, this limit was lifted when the gold standard collapsed in 1971. And since then, we've seen what can only be described as long-term inflation, with the prices of many assets exploding in fiat terms while staying the same when priced in gold. 

However, it’s become clear that this inflation didn't show up in official inflation statistics until very recently because they have been adjusted and under-reported since they were introduced to make them seem less severe. This inflation is starting to appear in the official statistics, which means it's even worse than the authorities reveal.

Individuals and institutions took on record debt levels when interest rates were low, which means that raising interest rates too high would result in an economic catastrophe as these individuals and institutions would be unable to pay back their debts. 

It’s also apparent that many governments have record debt levels, and we're already seeing the first signs of default in some countries. In short, the money supply has grown so much that inflation is off the charts. And raising interest rates is not an option because of all the debt built up in the financial system over the years.

CBDC Economics

From the banks' perspective, CBDCs offer a solution to this situation. This is because, in a CBDC system, one of the many features is that it'll be possible for the central bank to destroy money as well as issue it easily. For starters, there'll be two types of CBDCs. Select individuals and financial institutions will use wholesale CBDCs, and regular folks like you and I will use Retail CBDCs. 
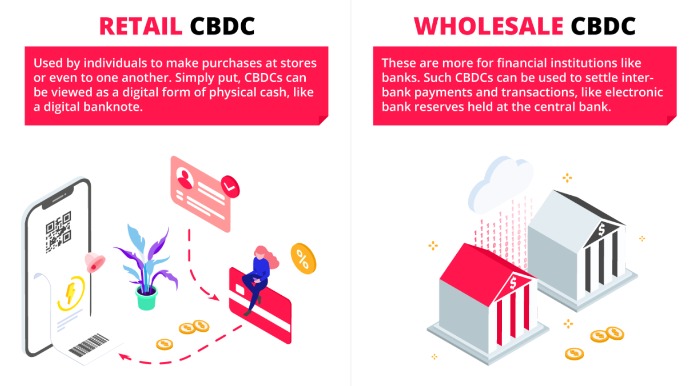

Image Source: Technode.global

This means there will be one financial system for the people in power and another for everyone else. Now, in addition, to being able to create and destroy money, Retail CBDCs will make it possible for central banks to; 

  • Freeze CBDC holdings. 
  • Set limits on CBDC holdings. 
  • Set expiry dates on CBDC holdings. 
  • Set location limits for where CBDCs can be spent.
  • Set time limits for when CBDCs can be spent. 
  • Set limits on how much CBDC can be spent. 
  • Decide what can and can't be purchased with CBDCs. 
  • Add a tax to every CBDC transaction. 
  • Automatically flag or block suspicious CBDC transactions.
  • Create custom CBDC limits for different individuals and institutions, depending on whatever criteria they decide. 
  • Implement negative interest rates by gradually deleting unspent CBDC holdings over time. 

Financial institutions have openly discussed all the above features of CBDCs. The craziest part is that a continued increase in centralized control is required to prevent the current financial system from imploding, at least as far as central banks and governments are concerned. 

Any alternative would involve giving up some or even all of the central banks' and governments' control over the financial system. They would much rather see the financial system burn to the ground than lose control of it. This is why the IMF has outright recommended countries use CBDCs to fight cryptocurrency adoption to maintain that control. Many institutions are even trying to wipe out the crypto industry.

Images sourced from imf.org.pdf

Cryptocurrency Economics

It depends on the coin or token we're discussing regarding cryptocurrency economics. Bitcoin’s BTC is the obvious choice to reference as an example since it's arguably the biggest crypto competitor to the current financial system. Unlike fiat currencies, BTC has a maximum supply of 21 million. This supply is created slowly over time, and every four years, the amount of new BTC being mined or created is cut in half. 

It's believed that the last BTC will be mind around 2140. As basic economics dictates, a gradual decrease in supply combined with the same or more demand results in a higher price. Over the years, Bitcoin has seen exponential adoption that has increased demand, while the new supply of BTC has been declining, resulting in the price action shown below. 
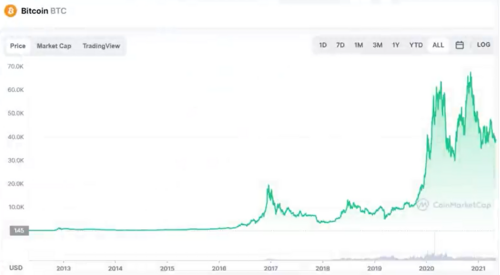

Image source: coinmarketcap.com

BTC’s gradual appreciation in price has incentivized millions of computers to process transactions on the Bitcoin blockchain, which has made it highly decentralized and, therefore, very secure. As a matter of fact, Bitcoin is believed to be the most secure payment network on the planet. 

The best part is that as BTC's price continues to climb, the Bitcoin blockchain will only continue to decentralize. This makes it the ideal base layer to build additional financial technologies, and many crypto projects and companies are leveraging the Bitcoin blockchain for its security. Because BTC is increasing in value over time, even relative to Gold, this creates a strong incentive to save rather than spend BTC.

 
The Custody Difference Between Cryptocurrencies and CBDCs. 

With cryptocurrencies, you have the option of self-custody, meaning you can keep your coins and tokens in a digital wallet that you entirely control. Because personal information isn't required to create a cryptocurrency wallet, all cryptocurrency transactions are pseudonymous by default. 

Unless you're holding cryptocurrency in your personal crypto wallet, chances are it's being stored in a custodial wallet, which includes cryptocurrency exchanges. This means that the crypto is technically owned by someone else under your name. You might think you have control over your crypto with such a setup, but in reality, the custodian only lets you make transactions so long as you abide by their terms and conditions.

Self-custody simply does not enter into the equation for CBDCs. If all the terms and conditions, or dare I say, restrictions mentioned above, didn't make it clear enough, the central bank will keep all your CBDC holdings and ultimately decide what you can or can't do with your digital money. 

Regarding privacy, I reckon this sentence from one of the CBDC reports from the Bank for International Settlements (BIS) sums it up “Full anonymity with CBDCs is not possible.” This is because the central bank needs to be able to track everything specifically to impose these sorts of totalitarian controls.

It goes without saying you’ll be required to complete the KYC protocol. Also, according to the World Economic Forum's Digital Currency report, central banks will assign your digital identity a dystopian social credit score, determining what you can and can't do. The result will be a total absence of privacy with CBDCs, which is a massive problem because privacy is required for financial freedom. 

CBDC transactions that don't belong to you will not be viewable, meaning only the central bank can see what's happening behind the scenes. This will also apply at the network level because the technology that underlies a CBDC will likely be a closed source. 

A View Of How Both Economic Systems Could Play Out

So what would a cryptocurrency-based economic system look like as opposed to a CBDC-based system? As mentioned above, BTC has been increasing in value over time, even relative to gold, creating a strong incentive to save rather than spend BTC. This makes a BTC-based economy analogous to one where interest rates are consistently high, meaning inflation would be very low or even negative. 

Logically, this means a BTC-based economy is also one where it would be more expensive to borrow, and that could limit economic expansion. In a worst-case scenario, this could lead to a deflationary death spiral, where spending decreases, resulting in lower prices, lower production, and so on, until the economy dies. 

The thing is that the threat of a deflationary death spiral is nothing more than a ‘fiat currency finance conspiracy theory,’ as evidenced by the fact that the economy has been deflationary for most of human history. This is simply because innovation makes everything cheaper as time goes on, and the deflationary trend only changes whenever a central bank decides to turn the money printer on.
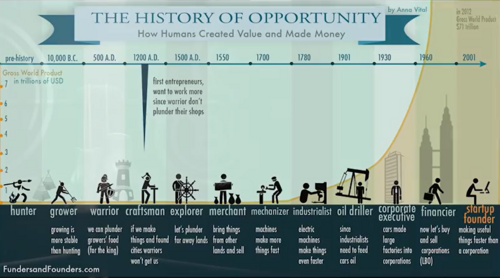

Image source: Adioma.com

A BTC-based economy also doesn't necessarily require using BTC as the currency. BTC could become the hard money that backs a more elastic currency, the same way gold was used to back national currencies, and that system has worked out pretty well. Ironically, a CBDC-based economy would face the same sort of deflationary risks for similar reasons. 

For instance, a CBDC status is considered a safe-haven asset in the eyes of the average investor. Multiple central banks have noted this status as the primary reason they're not rushing with their CBDC rollouts. A CBDC could siphon billions or even trillions of dollars from the traditional financial system. And this includes government bonds, which are also seen as safe-haven assets and considered cash equivalents by experienced investors and regulators alike. 

The interest rates on government bonds determine the interest rates in the broader economy, which are dictated by supply and demand. If everyone started selling government bonds for CBDCs because of a financial or geopolitical crisis, this would cause the interest rates in the economy to skyrocket, eventually leading to a next-level, deflationary death spiral and, potentially, even a full-on government default and collapse. Even if central banks programmatically put measures in place to prevent this scenario, a CBDC economy would still put central banks in direct competition with commercial banks. 

The Bank for International Settlements admitted in its CBDC report, “a common theme is that maintaining bank profitability would be challenging.” The Bank for International Settlements also determined that the only way a bank could remain profitable would be to raise interest rates. That would make borrowing extremely difficult and result in substandard economic conditions due to deflation.

Although, it seems the financial elite has a solution, and that's a synthetic CBDC, which was defined by the World Economic Forum in their CBDC and stable coin report. A synthetic CBDC would involve having a centralized stablecoin issuer holding the assets backing its stablecoin with a country's central bank. As discussed in this article, the two largest regulated stablecoins are supported almost entirely by cash equivalents, and that’s 'code' for government debt. 

This is quite clever because it means everyone buying a regulated stablecoin is financing the US government by indirectly purchasing government debt, which keeps interest rates low and allows its fiat ponzi to continue.


Image Source: Markethive.com

A Positive Note To Wrap Up

After studying various reports and following these topics, there’s arguably no chance CBDCs will reach mass adoption. There are a few reasons for this; 

Firstly, the Bank for International Settlements found that only 4-12% of people in developed countries would voluntarily adopt CBDCs. This is significantly lower than the current adoption rates for cryptocurrency. The fact that financial institutions are studying cryptocurrencies to recreate the same adoption curve with CBDCs is evidence of that. 

Secondly, the people who know how to create distributed ledger technologies are better off working on a blockchain than a distributed database. Creating a cryptocurrency coin or token that does something useful and valuable can result in astronomical profits and no shortage of social approval. Being involved in creating a CBDC will generate a six-figure salary at best and be seen as the enemy of society in the eyes of many.

Last but not least, central banks are losing the narrative on CBDCs. The awareness of the masses is continually increasing, with hoards of concerned citizens making their voices heard worldwide, physically and virtually, on thousands of truth-seeking internet media. 

The more people become aware of how dystopian these CBDCs are, the harder it will be for governments to roll them out. We're already starting to see politicians in the United States and elsewhere propose bills to prevent their central banks from issuing CBDCs, and it's because they are aware their voters don't want the Digital ID/CBDCs. 

The “pen is mightier than the sword” is an adage coined in 1839, and this phrase remains commonly known and used 182 years later. Or perhaps we can use a more updated version of a “post is mightier than a gun.” So, get the word out to the unawakened to ensure they know the difference between Central Bank Digital Currencies and honest-to-goodness Cryptocurrencies. 


Editor and Chief Markethive: Deb Williams. (Australia) I thrive on progress and champion freedom of speech. I embrace "Change" with a passion, and my purpose in life is to enlighten people to accept and move forward with enthusiasm. Find me at my Markethive Profile Page | My Twitter Account | and my LinkedIn Profile.


Tim Moseley
Gold trades lower until you factor in dollar weakness

Gold trades lower until you factor in dollar weakness

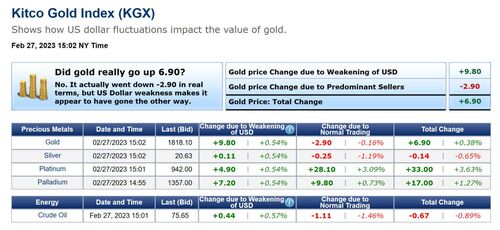
Gold would have traded lower today if it was not for the dollar's weakness. The dollar is currently down 0.543 points or 0.52% with the dollar index fixed at 104.615. Concurrently, gold futures basis most active April contract is trading up $7.00 or 0.40% and fixed at $1824.10. This means that dollar weakness accounts for over 100% of today’s gains in gold. The resulting net change of gold is based on the dollar weakness and fractional selling pressure in gold.

The same relationship between gold and the dollar can be seen in the physical or spot market. According to the Kitco Gold Index (KGX), spot gold is currently fixed at $1818.10 after factoring in today’s net gain of $6.90. On closer inspection dollar weakness resulted in spot gold gaining $9.80 with fractional selling pressure taking back $2.90 of those gains.

The question becomes what fundamental events could explain dollar weakness today? For that we need to look at two reports released today.

The first report revealed that new orders for manufactured durable goods decreased by $13 billion or 4.5% coming in at $272.3 billion.

The other report released today was pending home sales in January by the National Association of Realtors. This report revealed that pending home sales improved for the second consecutive month. Collectively all four U.S. regions posted that pending home sales increased by 8.1% month-over-month. However, when you look at the data year over year pending transactions decreased by 24.1%.

When you look at the durable goods and pending home sales (year-over-year) they both indicate that the economy in the United States is contracting. This seems to be the most plausible explanation for dollar weakness today which led to the fractional gains in gold.

By Gary Wagner

Contributing to kitco.com

Time to Buy Gold and Silver

Tim Moseley

Gold at risk of a major drop as prices at ‘pivotal point’ – analysts

Gold at risk of a major drop as prices at 'pivotal point' – analysts

With the latest inflation numbers stressing out markets across the board, gold is at a "pivotal point," according to analysts who are not ruling out a deeper selloff if gold drops below $1,800 an ounce.

This week's big surprise was the hawkish Federal Reserve meeting minutes, which revealed that "a few" FOMC members were leaning towards a 50-basis-point hike instead of the more dovish 25-bps increase adopted at the February meeting.

On top of that, the Fed's preferred inflation measure — the annual core PCE price index — accelerated in January, coming in at 4.7% versus the expected 4.3%.

"There's a major reset in how high rates will go. People are now thinking over 6%. That's significant enough that it is breaking gold's back," OANDA senior market analyst Edward Moya told Kitco News.

If there is further momentum towards $1,800 an ounce, it could "get ugly" for gold, and prices could drop another $50, Moya added.

At the time of writing, April Comex gold futures were trading at $1,816.60 an ounce, down for the fifth week in a row.

"This is a pivotal point right here," Forex.com senior technical strategist Michael Boutros told Kitco News. "If we get a weekly close below $1,807-$1,805, you risk a big drop. And you could be looking at $1,750s."

It is the macro outlook that is weighing on gold. In January, the precious metal rallied on the idea that the Fed could cut rates at the end of 2023.

Now, the reality is starting to set in, Boutros explained. "And inflation numbers we got today are showing that. And that adjustment to higher rates is hitting the markets," he said.

The good news for gold is that this rate re-pricing is also impacting the equity space. And if the S&P 500 and the Dow keep falling, gold might see some support as the safety trade, Boutros noted. "That should put some sort of floor under gold's price," he added.

Geopolitical tensions are also not letting up, which is working in gold's favor in terms of finding a bottom in this downtrend.

"People are throwing around all these big words like 'nuclear threats.' It is the first anniversary of the war in Ukraine, and it is time for a reality check. The threat is there. And if that threat becomes more prominent on a global scale and if these talks continue to deteriorate, at some point, that will factor in," Boutros pointed out.

The volatility in the gold market is far from over, as prices can fall as quickly as they recover, said Gainesville Coins precious metals expert Everett Millman.

"Given gold's nature to have these quick selloffs and recoveries during times of panic, there is not an extremely strong floor right now. I wouldn't be surprised to see gold break below $1,700, with expectations that it would come back up pretty quickly if there is an escalation in Ukraine," Millman told Kitco News.

With markets realizing the difficulty in bringing inflation down to the Fed's 2% target, gold will remain vulnerable in the short term.

"There is some support at $1,750, but then you don't have anything major until possibly $1,730. This is a major change in sentiment," Moya said.

Next week's data

Analysts will monitor the macro data scheduled for next week for any signs of weakness after a solid start to the year.

"We cautioned that the stark contrast in weather between December's wintery, cold conditions … and January's almost spring-like temperatures played a big part in the strength of data," said ING's chief international economist James Knightley. "[Next] week, we will get a first test of that hypothesis with the ISM manufacturing and service sector reports for February."

Monday: U.S. durable goods orders, U.S. pending home sales,

Tuesday: U.S. CB consumer confidence

Wednesday: U.S. ISM manufacturing PMI

Thursday: U.S. jobless claims

Friday: U.S. ISM non-manufacturing PMI

By Anna Golubova

For Kitco News

Time to Buy Gold and Silver

Tim Moseley

The Artist that came out of the Winter