

Gold remains above $1680 a key technical level as traders await the FOMC meeting
Gold remains relatively muted as market participants await the start of the Federal Open Market Committee meeting tomorrow. As of 5 PM EDT gold futures basis, the most active December contract is currently trading at $1685 with a net gain of $1.50 today. The December contract opened at $1685.40, traded to a low of $1667.60 and a high of $1688.80
.png)
This is in contrast to the other precious metals, with palladium futures gaining 5.55%, platinum futures gaining 2.28%, and silver gaining 1.03%. All of the precious metals had fractional gains based on dollar weakness. The dollar index is currently fixed at 109.34 after factoring in a decline of 0.15%.
Market participants are anticipating the Federal Reserve to announce the latest interest rate hike after this week’s FOMC meeting on Wednesday. Beginning in March of this year the Federal Reserve raised the “federal funds rate” for the first time since 2018 by 25 basis points. They continued to raise rates at the May, June, and July FOMC meetings. The net result was the Fed moved rates from near zero to its current level of 225 – 250 basis points. According to the CME’s FedWatch tool, there is an 82% probability that the Fed will raise rates by 75 basis points on Wednesday. This would be the third interest rate hike of 75 basis points this year.
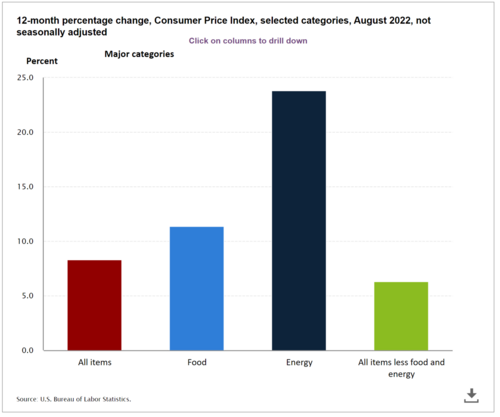
The Federal Reserve has been laser-focused on bringing inflation down to an acceptable level of approximately 2%. However, inflation remains exceedingly hot, and persistent. The CPI index hit a 41-year high in June coming in at 9.5%. The most recent data revealed that inflation remains extremely elevated coming in at 8.3% in August.
The majority of the decline in inflation is directly attributable to lower energy costs, with the gasoline index falling 7.7% in July. However, inflation for other essentials continues to be elevated. Prices for food at home rose 13.5% for the year ending in August.
According to the BLS, “Over that period, prices for food at home increased 13.5 percent, the largest 12-month percentage increase since the period ending March 1979. Food prices away from home increased 8.0 percent for the year ended August 2022, the largest over-the-year percentage increase since an 8.4-percent increase in October 1981.”
12-month cpi table
The graph above shows the 12-month percentage change in four categories in the Consumer Price Index. It clearly illustrates that the Federal Reserve is far from reaching its inflation target of 2% and has had only a minimal effect in reducing inflation even though it raised rates for the last four consecutive FOMC meetings, and will almost certainly enact another large rate hike of at least 75 basis points.
Even with another rate hike, it seems unlikely that the Federal Reserve will bring inflation close to its target level. The consensus among economists and analysts is that the Federal Reserve will raise rates to between 3 ½% to 4% by the end of the year. However, it must be noted that historically the Fed has had to raise rates to equal the level of inflation to effectively reduce inflation. It also must be noted that even the most aggressive rate hikes in the past by the Federal Reserve were accomplished over multiple years.
For more information on our service, simply use this link
Wishing you as always, good trading,
By Gary Wagner
Contributing to kitco.com
Time to buy Gold and Silver on the dips
Tim Moseley


 Inflation triggered worst market sell-off since 2020, analyst predicts even more pain – John Feneck
.gif)


 Bullish sentiment points to a limited short squeeze for gold prices, not a new breakout
 Perth Mint outpaces U.S. Mint in gold sales last Month
 Brace for a possible U.S. debt crisis if inflation stays elevated, democracy itself is at risk – Michael Gayed
(1).gif)
.gif)

(1).gif) Gold bears remain in control as short squeeze runs out of momentum
Gold bears remain in control as short squeeze runs out of momentum
.gif)

 Platinum remains well supported even as surplus grows to 974k ounces – WPIC