

Gold/platinum/silver – Is the bottom in?
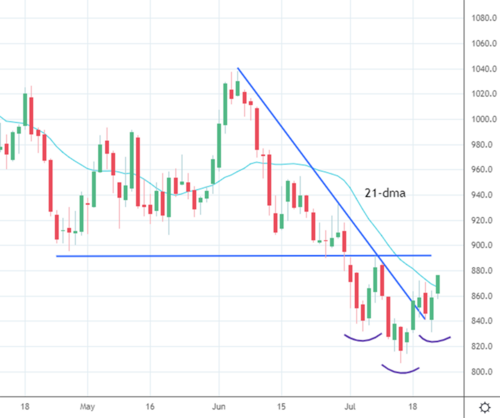
Every bear market ends, and a bull market begins with a short covering rally. Whether you use fundamental or technical analysis, the end result is the same with a change of direction. Since the March peak, Platinum has been trending lower for four months and is finally showing signs of a potential bottom. Thursday's trading range helped create the right shoulder of an inverse head and shoulder pattern. The consolidation over the past four trading sessions has created a flag that has helped accelerate prices through the 21-day moving average. To help you identify additional long-term support and resistance levels, we created a Free "5-Step Technical Analysis Guide that will provide you with all the Technical analysis steps to create an actionable plan used as a foundation for entering and exiting the market. You can request yours here: 5-Step Technical Analysis Guide to Gold.
Daily Platinum chart
Blue Line Futures correlation matrix
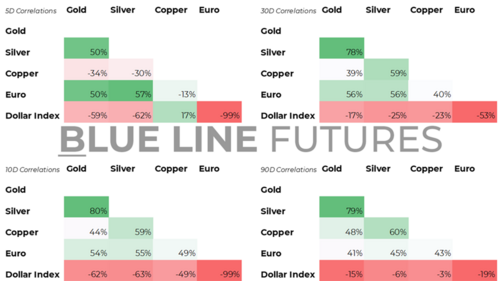
I wanted to share one of the slides I keep pinned on my desktop and will help you to understand how connected the precious metals are to the underlying currencies. On Thursday, the ECB raised rates by 50 bps for the first time in 11 years while rolling out the "Transmission Protection Instrument." That action created volatility across both the currencies and precious metals. TPI is a flexible bond-buying program that tames volatility as the ECB raises rates. Call this strategy bullish and bearish at the same time.
Commitment of traders
Every week the CFTC releases the commitments of traders report to help the public understand the dynamics of the market. Diving into the report, we can see that managed money and hedge funds have been short Platinum. We can also see that large speculators in Silver have taken their long exposure down to levels not seen in years, given the $8 sell-off since March. For the second time in history, we saw managed money go net short on Gold. The first time was 2015, which marked the low in Gold, and the second was in 2018, and from that point, Gold went into a multi-year bull market.
Daily Silver Chart
Daily Gold Chart
Our strategy and trend reversal points
We remain bearish, taking tactical shorts on U.S equities on any significant bounce targeting the Nasdaq and Russell 2000. The leveraged stocks that make up these indices are most at risk during a recession. We also maintain our bearish stance on crypto and traditional currencies such as the British Pound, Euro, and Yen. We are also bearish and targeting economically sensitive commodities such as Cocoa, Corn, and Soybeans on bounces. We maintain a bullish stance on China as it continues stimulating its economy. Crude Oil should remain firm in the front months while weakening over time as we get deeper into the recession. One of the most popular precious metals questions I fielded this week was, "at what levels will the "bearish trend" shift to "bullish/neutral"? Those levels are $1787 for August Gold, $3.82 for September Copper, $903.1 for October Platinum, and $20.20 for September Silver. If we see closes above these levels, you can expect the short covering to accelerate into outright longs. Any new positioning should be in December 2022 or into 2023 on futures contract purchases. If you have never traded Silver futures, we completed a new educational guide that answers your questions on transferring your current investing skills into trading "real assets," such as the 1000 oz Silver futures contract. Additionally, you will receive a free two-week trial to our flagship report, "The Morning Express," giving you critical levels of support in resistance in the Gold and Silver. You can request yours here: Trade Metals, Transition your Experience Book.
By Phillip Streible
Contributing to kitco.com
Time to buy Gold and Silver on the dips
Tim Moseley