Tag Archives: kinesismoneysystem

Gold bugs crow as the yellow metal breaks through 2500 per ounce to set fresh all-time highs

Gold bugs crow as the yellow metal breaks through $2,500 per ounce to set fresh all-time highs

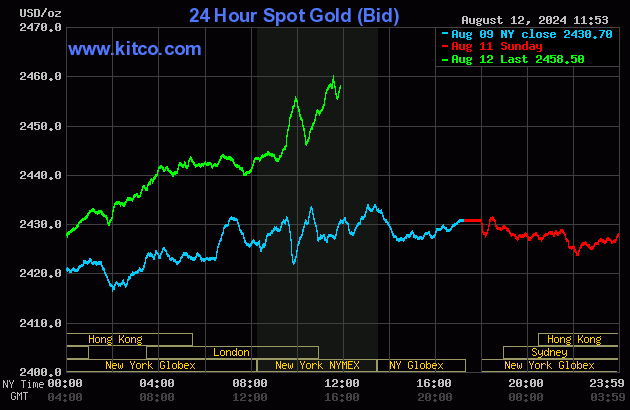
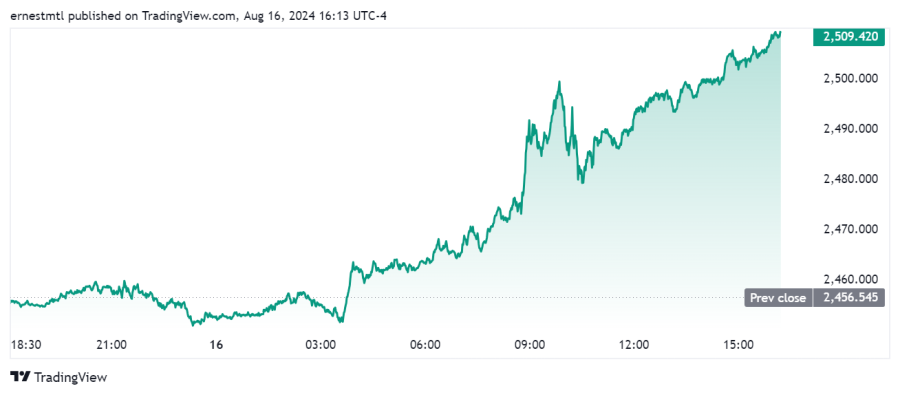
Gold prices hit new all-time highs in both spot and futures markets on Friday after weaker-than-expected U.S. housing data stoked worries that downside risks to growth are rapidly overshadowing the upside risks of inflation that have dominated the attention of investors and central banks for the last two years.

Spot gold first breached the $2,500 per ounce level shortly before 10 am EDT, just half an hour into the North American trading session and less than 90 minutes after the housing data was released.

After pulling back as low as $2,479 per ounce, the yellow metal began its steady march higher once again, and broke definitively above $2,500 just after 2:30 pm EDT.

At the time of writing, spot gold last traded at $2,509.42 for a gain of 2.15% on the session.

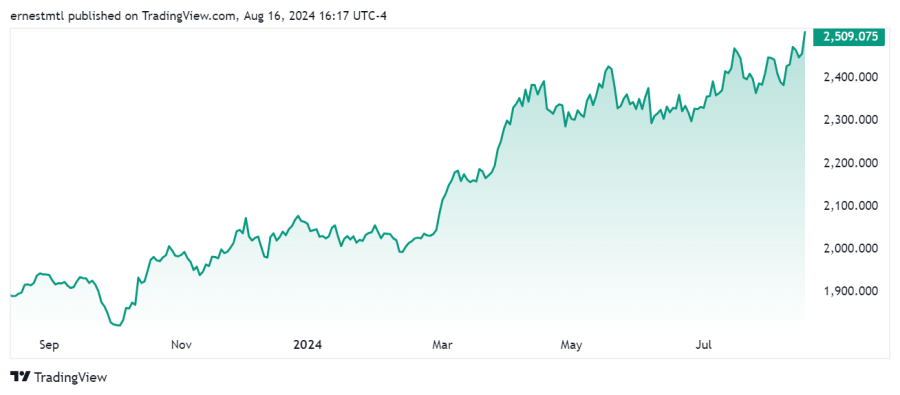
Gold has been on an unstoppable run since October last year, surging from near the $1,800 level to score back-to-back all-time record highs – not once, not twice, but on multiple occasions this year,” wrote Phil Carr, Head of Trading at The Gold & Silver Club on FXEmpire. “The precious metal is up over 26% since mid-February. But here’s where it gets even better – Gold prices have now chalked up a whopping gain of more than 38% since October.”

Carr also noted the historically strong correlation between U.S. government debt and gold prices.

Conclusive evidence shows during the period U.S national debt has ballooned from 5 trillion to 35 trillion dollars – Gold prices have risen by 8x since 2000,” he said. “But here’s where things really start to get interesting. If history repeats itself, Gold prices could reach $5,000 an ounce when U.S national debt hits the 70 trillion dollar mark.”

Others saw the yellow metal’s strength as an indication of political as well as economic concerns.

Gold hits 2500 for the first time in history ahead of Kamala's central planning unveil that will usher in even more runaway inflation,” Zerohedge wrote in an X post.

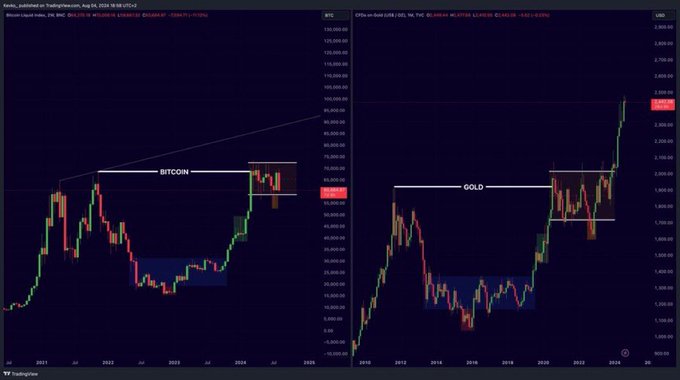
CryptoRover noted the correlation between the prices of gold and Bitcion.

Longtime gold bull and crypto critic Peter Schiff wasted no time weighing in on the precious metal’s performance, and what it says about U.S. monetary policy.

Powell claims he's data-dependent,” Schiff wrote in an X post. “Alan Greenspan, who once held his job, said the most important data point on #inflation is the gold price. He said if gold is breaking down, monetary policy is too tight. If it's breaking out, it's too loose. #Gold just broke out above $2,500!”

And veteran mining magnate Frank Giustra also chimed in on Friday as gold blew through resistance at $2,500.

For the most part, US mainstream Media chooses to ignore gold hoping it will just go away,” he said. “Meanwhile the rest of the world is loading up at record numbers. A rising gold price is a threat to the narrative that all is ok with the fiat currency system.”

Kitco Media

Ernest Hoffman

Time to Buy Gold and Silver

Tim Moseley

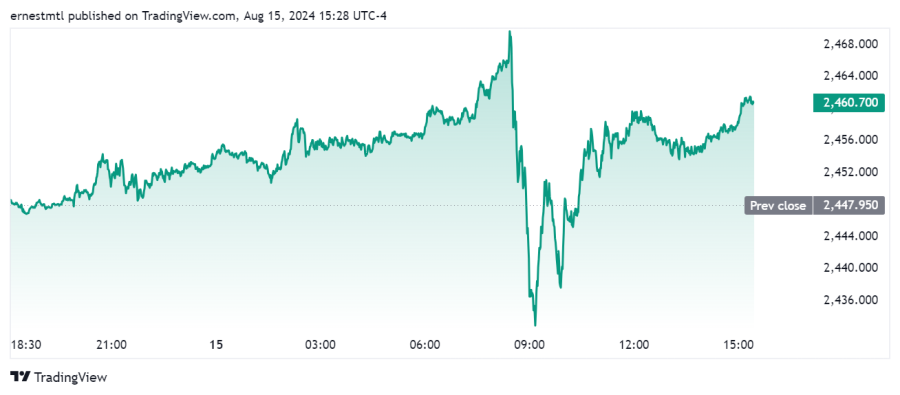
Spot gold holds modest gains above 2450 after US data relieves recession fears FXStreet’s Bednarik

Spot gold holds modest gains above $2,450 after U.S. data relieves recession fears – FXStreet’s Bednarik

Thursday morning’s raft of largely positive U.S. data has helped to ease recession worries and boosted stock markets near fresh weekly highs, with gold holding steady in its recent channel and providing buy opportunities on the dips, according to Valeria Bednarik, chief analyst at FXStreet.

Bednarik noted that spot gold was holding modest gains in afternoon trading following the morning’s volatility.

XAU/USD fell to $2,432.04 ahead of Wall Street’s opening as a batch of United States (US) data pushed speculative interest away from the safe-haven metal,” she said. “Financial markets welcomed news that US Retail Sales rose by 1% in July, far better than the 0.3% advance anticipated. Furthermore, Initial Jobless Claims rose by less than anticipated in the week ending August 9, up 227K vs the 235K forecast.”

The news drove the U.S. dollar higher against all major currencies, Bednarik noted. “US indexes also advanced, as the numbers spooked fears of a recession while maintaining unchanged the odds for an upcoming Federal Reserve (Fed) interest rate cut,” she said. “Stock markets remained optimistic after the opening, extending gains to fresh weekly highs, but the USD retreated. The second batch of US data was less encouraging, as Capacity Utilization hit 77.8% in July while Industrial Production in the same month was down 0.6%, both worse than expected and below June figures.”

Turning to the short-term technical outlook for the yellow metal, Bednarik pointed out that the daily chart for spot gold is trading comfortably within its recent range, but even though it remains in the green, “it has posted a lower high and a lower low, usually seen as a bearish sign.”

Technical indicators have turned marginally lower but remain within positive levels, limiting the odds of a steeper decline,” she said. “Finally, the pair keeps developing above all its moving averages, with the 20 Simple Moving Average (SMA) flat above bullish 100 and 200 SMAs. Overall, the case of a steeper leg lower seems unlikely.”

According to the 4-hour chart, Bednarik said the near-term outlook for XAU/USD is neutral to bullish.

Technical indicators turned higher, but remain at around their midlines,” she said. “Meanwhile, a mildly bullish 20 SMA provides dynamic resistance a few $ above the current level, while the longer moving averages extended their modest upward slopes below the current level. More relevantly, buyers defend the downside at around the 23.6% Fibonacci retracement of the June/July rally at $2,438.80.”

She added that support levels for spot gold are found at $2,438.80, $2,4260.90, and $2,438.80, while near-term resistance is pegged at $2,471.10, $2,483.70, and $2,495.00.

At the time of writing, spot gold last traded at $2,460.70 per ounce for a gain of 0.52% on the session.

Kitco Media

Ernest Hoffman

Time to Buy Gold and Silver

Tim Moseley

US dollar reserves drop 14 since 2002 as BRICS and gold challenge hegemony

US dollar reserves drop 14% since 2002 as BRICS and gold challenge hegemony

The decline of the U.S. dollar (USD) as the world’s reserve currency has been a popular topic of conversation for years – especially in the wake of the global financial crisis (GFC) of 2007-2008 – and while talks of its impending demise may be overblown, data provided by the Atlantic Council shows that the world is indeed utilizing the USD significantly less than at the turn of the century.

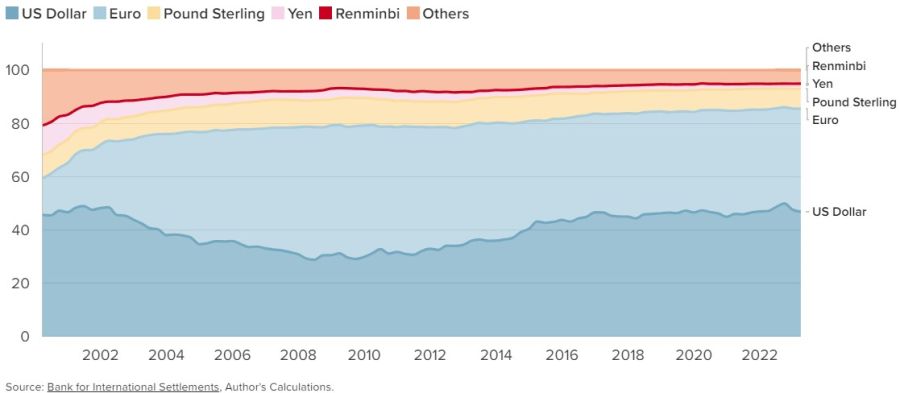
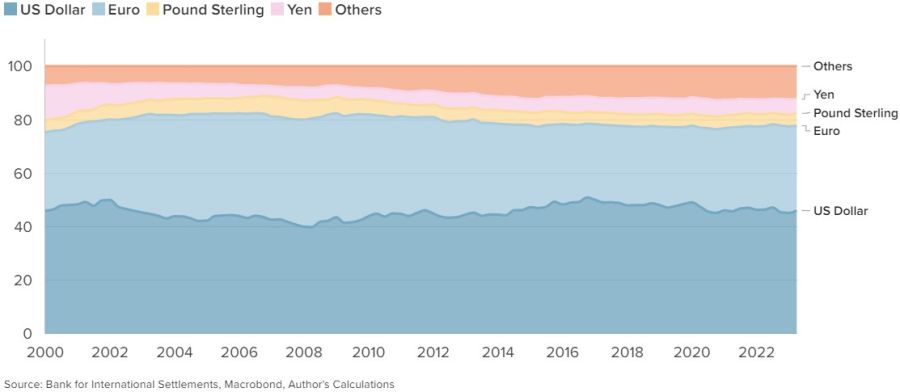
According to the Atlantic Council’s Dollar Dominance Monitor, the share of the USD in global reserves stood at 58% in 2024, a 14% decline from 2002 when it accounted for 72% of global reserves.

The US dollar has served as the world’s leading reserve currency since World War II,” the report said. “Today, the dollar represents 58 percent of the value of foreign reserve holdings worldwide. The euro, the second-most-used currency, comprises only 20 percent of foreign reserve holdings.”

But in recent years, and especially since Russia’s invasion of Ukraine and the Group of Seven (G7)’s subsequent escalation in the use of financial sanctions, some countries have been signaling their intention to diversify away from dollars,” researchers at the Atlantic Council said.

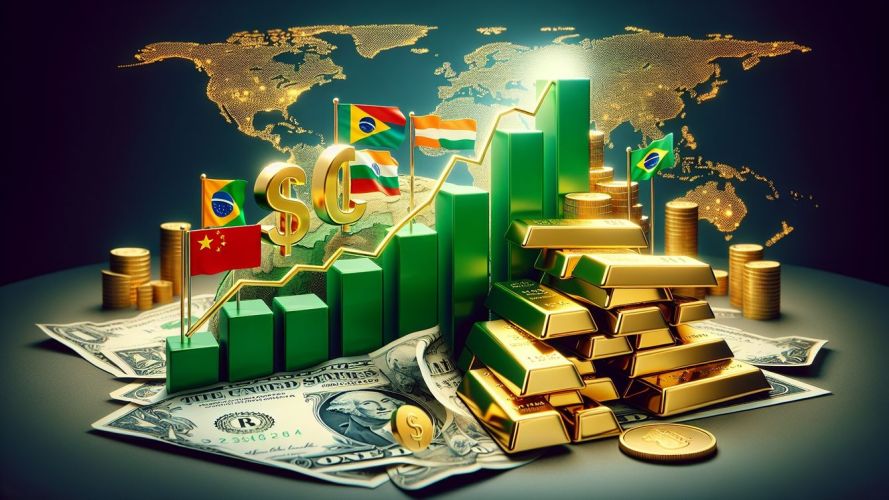
The pace of de-dollarization has picked up in recent years, and the researchers pointed to one development that has hastened this trend: the growth of BRICS.

Over the past twenty-four months, the members of BRICS (a grouping of Brazil, Russia, India, China, and South Africa that recently added Egypt, Ethiopia, Iran, and the United Arab Emirates; Saudi Arabia is considering joining) have been actively promoting the use of national currencies in trade and transactions,” the report said. “During this same time, China has been expanding its alternative payment system to its trading partners and seeking to increase international usage of the renminbi.”

The project identifies the BRICS as a potential challenge to the dollar’s status due to the individual members’ signal of intent to trade more in national currencies and the BRICS’ growing share of global GDP,” they added. “Among the BRICS currencies, the renminbi has the highest potential of competing with the dollar as a trade and reserve currency.”

Two key indicators identified by the report that highlight the growing strength of the alternative financial infrastructure China is building are “China’s swap lines with the BRICS countries and membership in China’s Cross-Border Interbank Payment System (CIPS),” they wrote.

The researchers found that between June 2023 and May 2024, “CIPS added sixty-two direct participants and now comprises 142 direct and 1,394 indirect participants.”

SWIFT is still by far the dominant player, with more than 11,000 connected banks,” they noted. “Since the direct CIPS participants could clear transactions without relying on SWIFT or the dollar, traditional indicators of renminbi use may be undercounting the actual value.”

While China has been making strides in adding partners to CIPS, the researchers said “The dollar’s role as the primary global reserve currency is secure in the near and medium term.”

The dollar continues to dominate foreign reserve holdings, trade invoicing, and currency transactions globally,” they said. “All potential rivals, including the euro, have a limited ability to challenge the dollar in the immediate future.”

As for the development of an intra-BRICS payment system, the Atlantic Council found that negotiations around such a system “are in the early stages, but the members have reached bilateral and plurilateral agreements with one another, with a focus on cross-border wholesale central bank digital currency (CBDC) and currency swap agreements.”

These agreements are likely difficult to scale due to regulatory and liquidity issues but may form the basis for a currency exchange platform over time,” the researchers said.

While China poses the single greatest threat to the standing of the USD, its recent struggles, including a collapsing real estate market, have seen the renminbi lose some of the ground it had gained on the USD in foreign currency reserves.

In the last quarter of 2023, the share of renminbi in global foreign currency reserves dropped to 2.3% from the peak of 2.8% in 2022, despite Beijing’s active support of renminbi liquidity through swap lines,” the report said. “Reserve managers might be perceiving the renminbi as a geopolitically risky currency because of concerns about China’s economy, Beijing’s position on the Russia-Ukraine war, and increased tensions with the US and G7.”

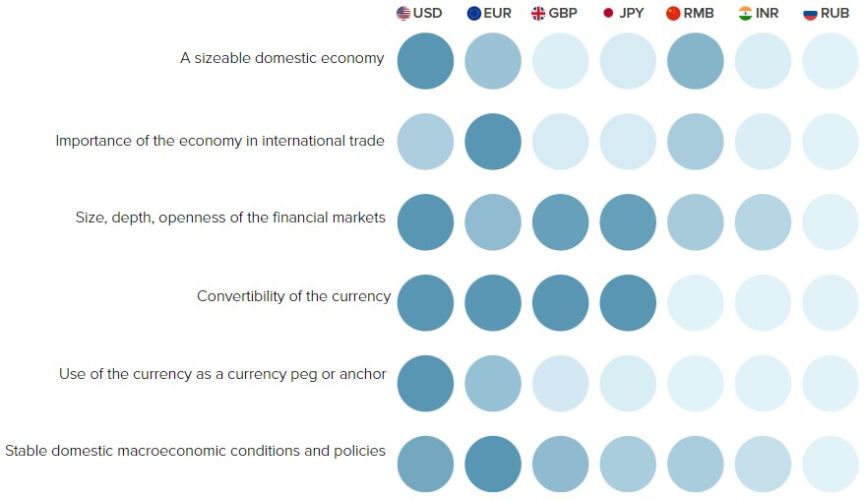
Based on the six “essential qualities of a reserve currency” identified by the Atlantic Council, the euro is the most suited to become a reserve currency behind the USD, followed by the renminbi.

The dollar and euro collectively form nearly 80 percent of global foreign exchange reserves,” the report said. “While the dollar-share is on a very modest long-term declining trend, its lost share has been distributed among several currencies.”

The dollar also accounts for “nine out of every ten currency transactions” on the international market, which “reflects the dollar's ‘vehicle’ or intermediary role in forex markets which minimizes transaction costs for traders and reinforces the dollar's centrality in financial networks,” the authors noted.

Since the currency of settlement and currency of invoicing are often closely tied to each other, the dollar’s use as a medium of exchange is linked to its status as the global unit of account,” said Martin Mühleisen, Senior Fellow at the Atlantic Council.

The dollar also plays a substantial role in the international debt markets. “Debt securities provide a channel for the private sector to store value,” the report said. “The dollar, euro, and pound together form more than 90 percent of outstanding international debt securities. Following the 2008 Global Financial Crisis, the dollar recovered the share that it lost in the 2000s.”

The dollar and euro are also the workhorses powering the international banking system.

Approximately 45 percent of banking claims across national borders or denominated in a foreign currency are held in dollars,” the authors said. “The dollar remains the most important currency in the international banking system, partly as a result of its role as a vehicle currency.”

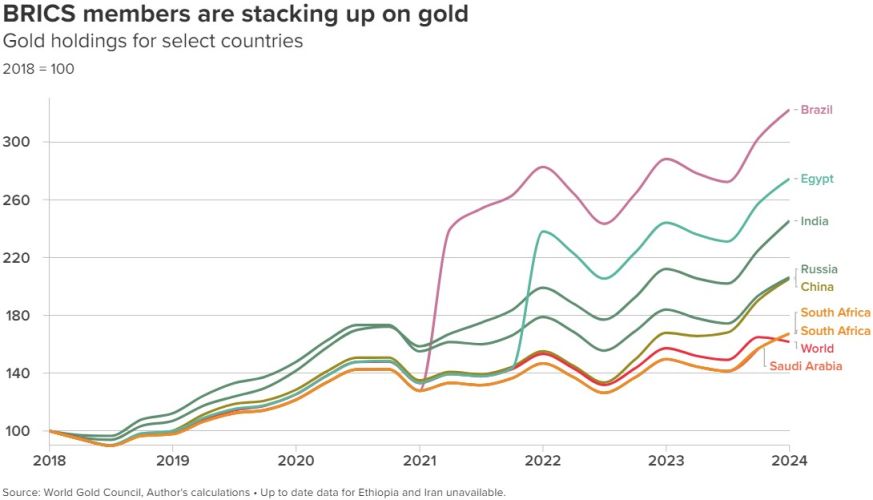
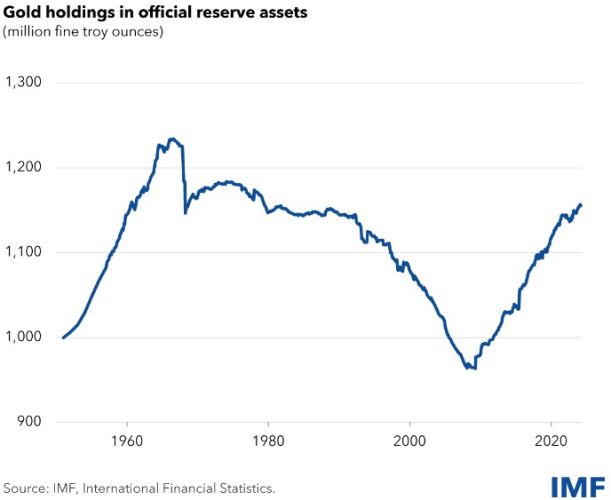
While other currencies have struggled to gain ground against the USD, the Atlantic Council noted that there is one commodity that has gained favor with BRICS members: gold.

Emerging markets have driven the surge in recent gold purchases,” the report said. “Since 2018, all members of BRICS have increased their gold holdings at a faster rate than the rest of the world, despite its historically high prices.”

Many advanced economies accumulated large gold reserves over centuries and retained them over the 20th century to maintain the gold standard following the end of the Second World War,” the authors said. “Recent surveys suggest that advanced economies are now planning to increase their gold holdings to hedge against the risks of economic shocks. This will further raise global demand for gold over the next few years.”

Emerging markets tend to keep the majority of their reserves in foreign exchange, but have steadily increased the share of gold,” they added.

Getting into the finer details, the authors noted that gold’s share in international reserve portfolios “began rising in 2019 and accelerated following the onset of the pandemic, rising from about 10% to nearly 16% today. Central banks now collectively hold more than 35,000 tonnes of gold, nearly 20% of all gold ever mined.”

Reasons for emerging market central banks purchasing gold include the fact that the precious metal “provides options in the face of geopolitical risk; provides a hedge against inflation; is considered a safe haven asset, particularly in moments of broader economic downturns as it has held its value over centuries and does not bear any credit risk; and it provides a hedge against dollar value swings,” the authors said.

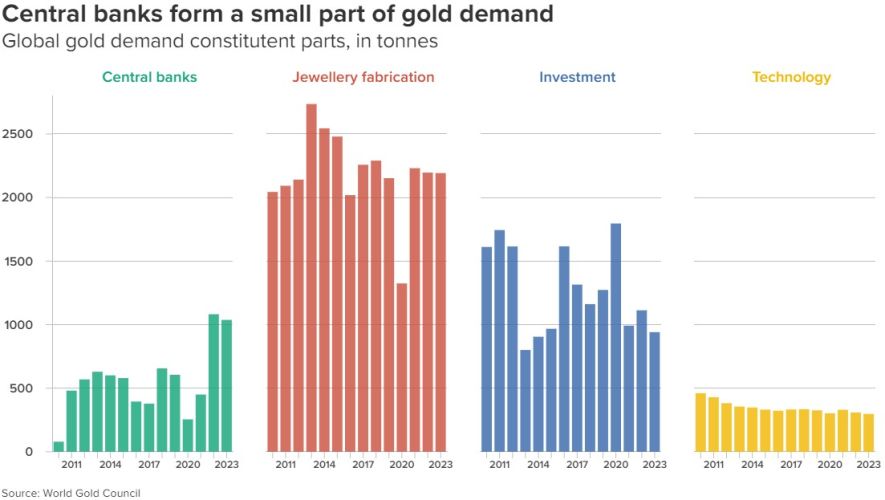
Jewelry fabrication was cited as the primary driver in demand for gold.

The metal is also used as an investment tool by non-institutional agents in the form of bars, coins, and ETFs,” the report said. “Due to its electrical conductivity, malleability, and corrosion resistance, gold is also used in electronics, industrial equipment, and dentistry.”

Central bank demand for gold has traditionally been dwarfed by other demand drivers of the metal, but central banks have boosted their demand since 2022,” they noted. “This upswing coincides not only with Russia's invasion of Ukraine, but also with a spike in inflation around the world, dollar strength, and heightened geopolitical uncertainty.”

Nearly a third of all central banks plan on increasing their gold reserves in 2024,” the authors concluded. “While the euro was once considered a competitor to the dollar’s international role, it continues to lag far behind and is weakening as an attractive reserve currency. The 2022 sanctions on Russia signaled to reserve managers that the euro exposed them to similar geopolitical risks as the dollar. Those looking to de-risk away from the dollar have turned to gold.”

A June report from the IMF corroborated the report from the Atlantic Council, finding that there is an “ongoing gradual decline in the dollar’s share of allocated foreign reserves of central banks and governments.

Strikingly, the reduced role of the US dollar over the last two decades has not been matched by increases in the shares of the other ‘big four’ currencies – the euro, yen, and pound,” the report added. “Rather, it has been accompanied by a rise in the share of what we have called nontraditional reserve currencies, including the Australian dollar, Canadian dollar, Chinese renminbi, South Korean won, Singaporean dollar, and the Nordic currencies.”

These nontraditional reserve currencies are attractive to reserve managers because they provide diversification and relatively attractive yields, and because they have become increasingly easy to buy, sell and hold with the development of new digital financial technologies (such as automatic market-making and automated liquidity management systems),” the IMF explained.

The IMF report also cited an increasing appetite for gold by central banks following the financial sanctions the U.S. imposed on Russia after it invaded Ukraine.

[F]inancial sanctions, when imposed in the past, induced central banks to shift their reserve portfolios modestly away from currencies, which are at risk of being frozen and redeployed, in favor of gold, which can be warehoused in the country and thus is free of sanctions risk,” the report said. “That work also showed that the demand for gold by central banks responded positively to global economic policy uncertainty and global geopolitical risk.”

These factors may lie behind the further accumulation of gold by a number of emerging market central banks,” they added. “Before making too much of this trend, however, it is important to recall that gold as a share of reserves still remains historically low.

In sum, the international monetary and reserve system continues to evolve,” the IMF concluded. “The patterns we highlighted earlier – very gradual movement away from dollar dominance, and a rising role for the nontraditional currencies of small, open, well-managed economies, enabled by new digital trading technologies – remain intact.”

Kitco Media

Jordan Finneseth

Time to Buy Gold and Silver

Tim Moseley

ETF inflows skyrocket in July as North American funds join the party to drive global growth World Gold Council

ETF inflows skyrocket in July as North American funds join the party to drive global growth – World Gold Council


Global gold ETFs enjoyed their strongest month of inflows since April 2022 after North American funds finally joined their counterparts, according to data from the World Gold Council.

In their latest Gold ETF Flows report for July, analysts at the World Gold Council reported that global gold-backed exchange-traded funds (ETFs) saw their third consecutive month of inflows, adding $3.7 billion in bullion investment during the month. And while the numbers were very strong, the biggest surprise was the region that drove the growth.

Notably, all regions reported positive flows this month with Western gold ETFs contributing the most,” the WGC wrote. “A combination of the July inflow and a 4% rise in the gold price pushed total global assets under management (AUM) 6% higher to US$246bn, a new month-end record. Collective holdings concluded July with a 48t increase, reaching 3,154t.”

Successive inflows over recent months have narrowed the y-t-d loss in global gold ETFs to US$3bn,” they noted. “And while collective holdings have fallen by 72t (-2%) so far in 2024, their total AUM rose by 15%, supported by a 17% increase in the gold price.”

European and North American funds are still negative overall in 2024 despite the trend change in July, they said, while Asia has recorded sizable inflows this year.

In terms of the regional breakdown, North American funds recorded $2 billion in inflows, more than making up for the minor outflows seen in May and June.

July was unprecedented in the political front with the assassination attempt on Trump followed by Biden stepping down from the presidential race,” they noted. “Gold ETF saw inflows around both dates, pointing to increased safe-haven demand. Meanwhile, falling inflation, the cooling labour market and the US Fed Chair Powell’s note that a cut in September is ‘on the table’ during the recent meeting intensified investor expectation of easing soon. In turn, US Treasury yields fell and the dollar weakened, pushing the gold price to a record high during the month and spurring investor interest in gold ETFs. Furthermore, we believe equity market volatilities, especially during the second half of July, also supported gold ETF demand.”

North American outflows now total $2.9 billion year-to-date, and collective holdings have fallen by 52t, second only to Europe. “Nonetheless, driven by recent inflows and the notable gold price strength, the total AUM of North American funds has risen by 14% y-t-d,” the analysts said.

But the tide had already turned in Europe months ago. The region “has now recorded inflows over three successive months, attracting US$1.2bn in July, the strongest since March 2022,” the WGC noted, with the UK and Switzerland leading inflows.

A common backdrop across the region in July has been declining government bond yields,” they said. “Although the European Central Bank left rates unchanged at their July meeting, Lagarde’s comment that the September decision is ‘wide open’ intensified investor expectation for another cut in the near future. Meanwhile, investors had expected the Bank of England to start its easing cycle on 1 August – and it lived up to the market consensus, cutting 25bps, the first time in four years. In addition, a commitment to address fiscal challenges from the new UK Chancellor, Rachel Reeves, helped restore some confidence in public finances and contributed to a lowering of UK gilt yields.”

And as the opportunity cost of holding gold fell, investor interest in gold ETFs rose in the region – further boosted by a record-setting gold price,” they said.

The last three months of inflows have narrowed the European losses to $3.7 billion year-to-date, and cut the overall decline in holdings to 66 tonnes. “Similar to North America, a higher gold price, alongside recent positive demand, lifted the total AUM of the region’s funds to US$103bn, a 12% rise,” the analysts said.teaser image

Asian investors, meanwhile, bit the bullet of high prices for the yellow metal as they extended the region’s consecutive streak of inflows to 17 months with $438 million in net gains in July, with India leading inflows.

Strong Indian demand was mainly aided by changes announced in the recent budget which effectively shortens the long term investment qualifying time period and lowered the associated tax rate which makes the investment landscape for gold ETFs more equitable and attractive,” the WGC wrote. “A strong gold price in the local currency also helped. Net inflows were also observed in China and Japan – likely driven by similar factors namely equity market weaknesses and strong local gold price performances in the month.”

Even with the relative slowdown in the pace of growth in July’s, Asia has still registered total inflows of $3.6 billion in 2024, “significantly outpacing all other markets,” with China and Japan the main drivers. “Supported by record-breaking inflows and a higher gold price, the total AUM of Asian funds reached US$15bn, the highest ever, while collective holdings increased by 47t,” the analysts said.

In other regions, July marks a second consecutive month of mild inflows, mainly from South Africa where post-election political uncertainties may have helped,” the WGC said. “Australia also experienced positive flows, likely fuelled by a strong gold price performance in the depreciating local currency. So far in 2024 funds listed in other regions saw inflows of US$40mn, due mainly to South Africa.”

Trading volumes also rebounded across global markets, averaging $250 billion per day in July, an increase of 27% from June and well above the 2023 average of $163 billion per day.

Similar to June, stronger LBMA volumes drove global over-the-counter (OTC) trading activities 16% higher to US$150bn/day, representing a 13% m/m rise in tonnage terms,” the analysts noted. “Trading volumes across all major exchanges rose in July, a staggering 51% increase m/m with COMEX leading the rise. Trading activities of global gold ETFs also rose, increasing by 9.3% m/m, mainly driven by North American funds.”

COMEX total net longs also saw a significant rise of 2% during the month, finishing July at 783 tonnes. “Continued strength in gold and falling yields amid intensifying expectations of lower interest rates ahead pushed money manager net longs – the major component of COMEX gold net longs – to 588t by the end of July,” the WGC said. “This represents a 2% m/m rise and the highest month-end level since February 2020.”

Kitco Media

Ernest Hoffman

Time to Buy Gold and Silver

Tim Moseley

Gold silver rally amid bullish outside markets

Gold, silver rally amid bullish outside markets

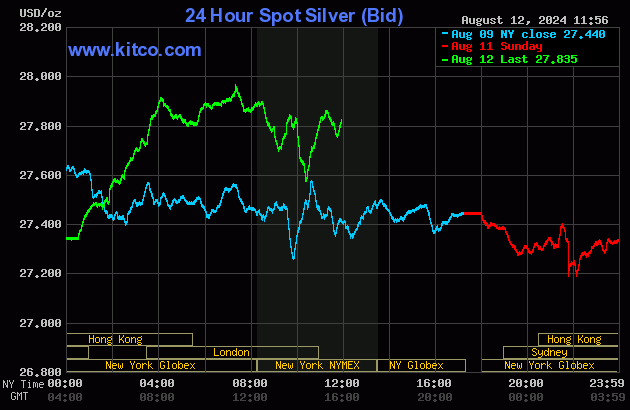
Gold and silver prices are higher, with gold solidly up, near midday Monday. The precious metals are being supported in part by bullish daily outside market elements that include higher crude oil prices and a slight down-tick in U.S. bond yields. The gold market also sees technical buying on a bullish chart posture. Silver is also being supported by some short covering in the futures market and some perceived bargain buying after recent selling pressure. December gold was last up $23.60 at $2,497.10. September silver was up $0.287 at $27.87.

Metals traders are awaiting the U.S. data points of the week: the July producer price index on Tuesday and the consumer price index for July on Wednesday. PPI is seen up 0.2% from June and the CPI is also seen up 0.2%, month-on-month. The retail sales report on Thursday will also be closely scrutinized by the marketplace.

Asian and European stock indexes were mixed but mostly firmer overnight. U.S. stock indexes are mixed at midday. The U.S. stock indexes have made solid rebounds from their August lows, but the bulls are not out of the woods yet.

The key outside markets today see the U.S. dollar index near steady. Nymex crude oil prices are up and are trading around $78.50 a barrel. A DowJones Newswire headline today reads: “Oil edges higher as markets brace for Iran retaliation.” The benchmark 10-year U.S. Treasury note is presently fetching around 3.96%.

Technically, December gold bulls have the solid overall near-term technical advantage. Bulls’ next upside price objective is to produce a close above solid resistance at the contract high of $2,537.70. Bears' nextnear-term downside price objective is pushing futures prices below solid technical support at $2,350.00. First resistance is seen at today’s high of $2,500.30 and then at $2,516.60. First support is seen at the overnight low of $2,462.70 and then at $2,450.00. Wyckoff's Market Rating: 7.5.

September silver futures bears have the overall near-term technical advantage. Prices are in a 2.5-month-old downtrend on the daily bar chart. Silver bulls' next upside price objective is closing prices above solid technical resistance at the August high of $39.355. The next downside price objective for the bears is closing prices below solid support at $26.00. First resistance is seen at today’s high of $28.08 and then at $28.50. Next support is seen at today’s low of $27.28 and then at $27.00. Wyckoff's Market Rating: 3.5

(Hey! My “Markets Front Burner” weekly email report is my best writing and analysis, I think, because I get to look ahead at the marketplace and do some market price forecasting. Plus, I’ll throw in an educational feature to move you up the ladder of trading/investing success. And it’s free! Sign up here; it’s real easy. https://www.kitco.com/services

Kitco Media

Jim Wyckoff

Time to Buy Gold and Silver

Tim Moseley

Gold will maintain its upward momentum as Fed cuts sovereign buying ETF flows support prices ING’s Manthey

Gold will maintain its upward momentum as Fed cuts, sovereign buying, ETF flows support prices – ING’s Manthey


(Kitco News) – Gold prices will peak in the fourth quarter as investors focus on Fed cuts, while ETF inflows and central bank buying continue to provide support against a backdrop of geopolitical risk, according to Ewa Manthey, Commodities Strategist at ING.

In the bank’s monthly update, Manthey noted that gold fell along with the global equities sell-off at the start of the week as fears of a U.S. recession spiked. “Gold, usually a safe haven during such uncertainty, sold off sharply on Monday amid likely liquidations to cover margin calls on other assets,” she said.

Looking ahead, we believe gold should regain its footing once again, amid the ongoing geopolitical uncertainties and expectations of interest rate cuts from the US Fed,” Manthey said. “Despite Monday’s sharp drop, gold is still up about 15% so far this year and is one of this year’s best-performing commodities, aided by central bank buying, Asian consumers and expectations the Fed is getting close to cutting rates. It hit an all-time high in July amid strong appetite from central banks and Asian consumers.”

We believe, after a consolidation phase, gold will maintain its upward momentum,” she added.

Manthey wrote that the attention of gold investors is squarely focused on the scale and timing of the Federal Reserve’s expected interest rate cuts.

The Fed has held its key policy rate in a target range of 5.25% to 5.5% – the highest level in more than two decades – since last July,” she said. “Our US economist now sees a 50bp cut in September followed by a series of 25bp moves that would get us back to a Fed funds rate of around 3.5% by next summer.”

She noted that central bank buying remained relatively strong in June, with World Gold Council data showing 12 tonnes of net buying during the month.

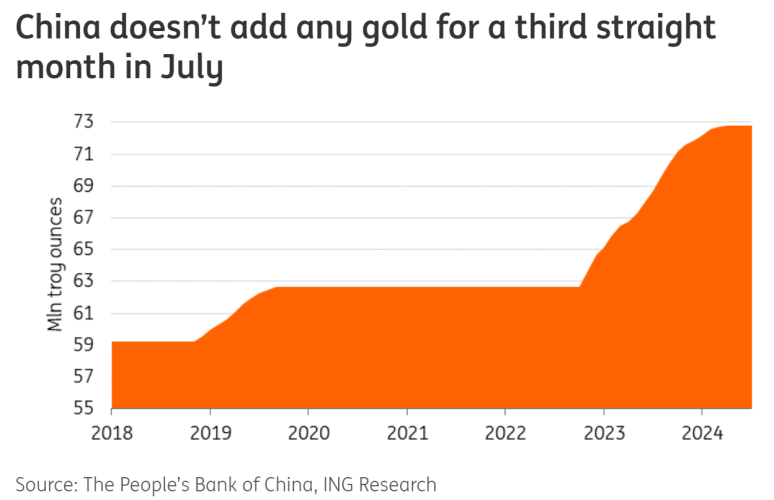
June’s purchases were once again led by emerging market central banks. Uzbekistan and India both added 9 tonnes to their gold reserves during the month,” Manthey said. “However, China has seen a slowdown in gold purchases over recent months. The People’s Bank of China didn’t add gold to its reserves for a third consecutive month in July.”

The largest seller in June was Singapore, which liquidated 12 tonnes – “it reduced its gold reserves in June by the most since at least 2000,” Manthey said.

Buying strength continues this year, although gross purchases and sales are lower compared to the same period last year,” she noted. ‘In 2023, central banks added 1,037 tonnes of gold – the second-highest annual purchase in history – following a record high of 1,082 tonnes in 2022. However, we still expect central bank demand to remain strong looking ahead amid the current economic climate and geopolitical tensions and as prices retreat from record highs.”


Manthey also pointed out that funds have continued their recent streak of positive flows.

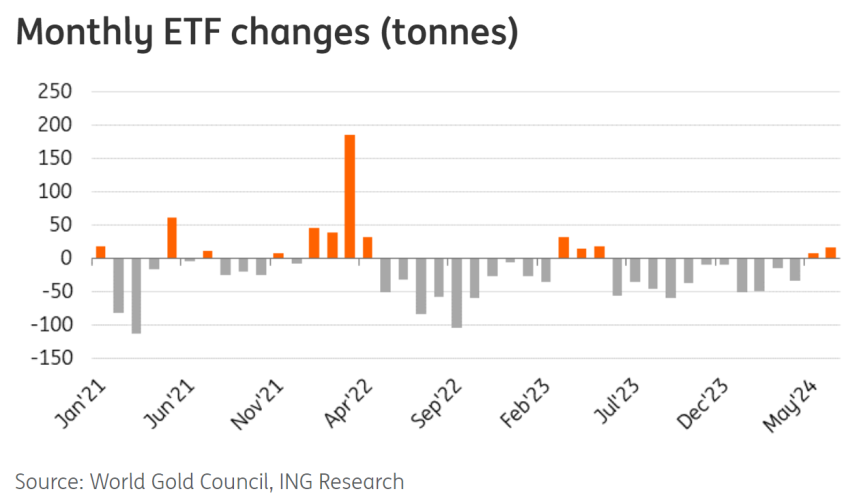
Following the strongest month since May 2023, global gold ETFs have now seen inflows for two months in a row, according to data from the WGC,” she wrote. “In June, notable European and Asian buying offset outflows from North America. Although June and May inflows helped limit global gold ETFs’ year-to-date losses to US$6.7bn (-120t), this remains the worst first half of the year since 2013 – both Europe and North America saw hefty outflows while Asia was the only region with inflows.”

Investor holdings in gold ETFs generally rise when gold prices gain, and vice versa,” Manthey said. “However, gold ETF holdings have been in decline for much of 2024, while spot gold prices have hit new highs. ETF flows finally turned positive in May.”

ING believes gold will peak in the fourth quarter as geopolitics will continue to drive price action. “The war in Ukraine and the Middle East and tensions between the US and China suggest that safe-haven demand will continue to support gold prices in the short to medium term,” she said. “The US presidential election in November and the long-awaited US Fed rate cut will also continue to add to gold's upward momentum through to the end of the year, in our view. Central banks are also expected to keep adding to their holdings, which should offer support.”

We see gold averaging $2,380 in the third quarter and prices peaking in the fourth quarter at $2,450/oz, resulting in an annual average of $2,301/oz.

ING sees spot gold averaging $2,380 in the third quarter before prices peak at $2,450 per ounce in Q4 for an annual average of $2,301 per ounce.

Kitco Media

Ernest Hoffman

Time to Buy Gold and Silver

Tim Moseley

Wall Street sees consolidation in the cards for next week Main Street maintains bullish bent

Wall Street sees consolidation in the cards for next week, Main Street maintains bullish bent

Markets began this week with one of the most profound shocks in recent years after the unwind of the yen carry trade and fears of a U.S. recession combined to drive risk assets sharply lower, dragging gold prices down along with them.

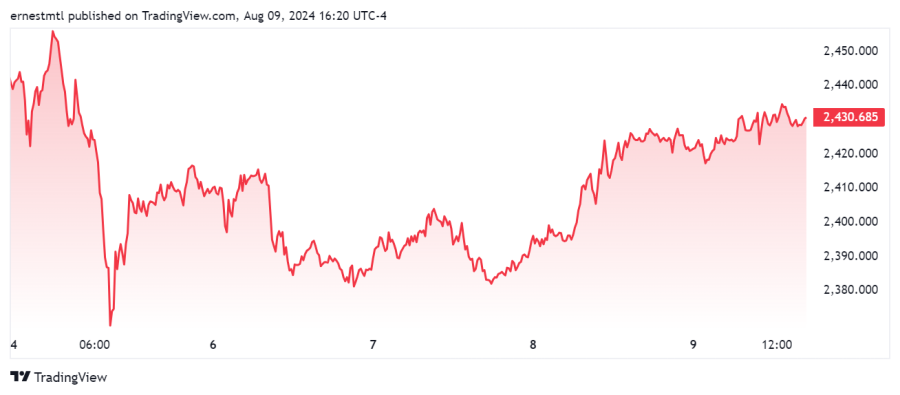
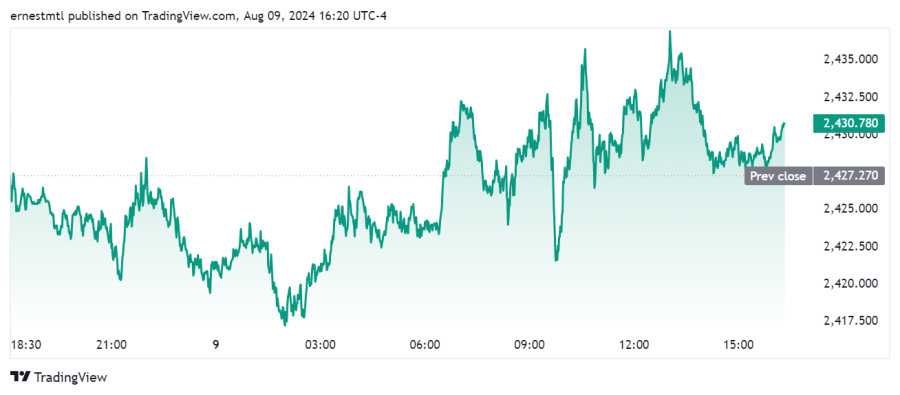
After opening the week trading close to $2,440 per ounce, spot gold saw a double bounce at $2,420 as news of the collapse of Japanese equities hit the wires, causing crypto and other risk assets to drop sharply during overnight trading. Gold initially saw a rally off their lows, with the spot price rising to a session high just shy of $2,460 per ounce shortly after midnight EDT as investors fled to safety.

But as the panic spread through the Asian and European sessions, gold was dragged lower once again, and after failing to hold support at $2,420 per ounce, spot gold began its own collapse shortly after 6:30 a.m., falling $60 in two hours.

After bouncing twice at the session low of $2,365 per ounce just after 8:30 a.m. on Monday, spot gold shot higher over the next couple of hours, eliminating nearly half of its losses by 11:00 a.m. EDT.

From there, gold prices stabilized along with equities, and the yellow metal established a range between $2,380 and $2,415 per ounce which it maintained throughout the middle of the week.

Thursday morning's better-than-expected weekly jobless claims report brought renewed optimism to both equities and precious metals markets, and drove spot gold to the edge of $2,430 throughout Thursday and Friday, but the yellow metal was rebuffed after every attempt to break through this resistance level. Still, the spot price never fell more than $2 below $2,420 per ounce for the duration of the week.
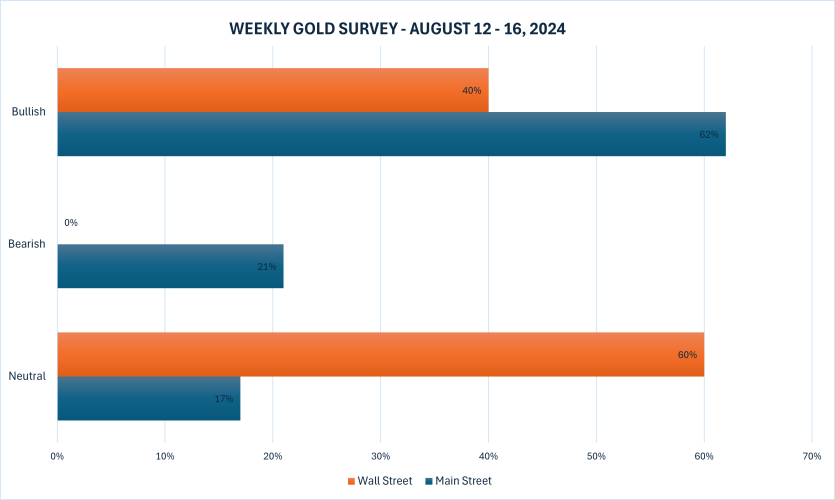
The latest Kitco News Weekly Gold Survey shows most industry experts predicting sideways price action next week, while the majority of retail traders expect the yellow metal to post gains.

I am neutral on gold for the coming week,” said Colin Cieszynski, Chief Market Strategist at SIA Wealth Management. “I just have the feeling that coming off a volatile ten days, markets may settle down a bit next week before the Democratic convention starts the following week.”

Marc Chandler, Managing Director at Bannockburn Global Forex, also expects gold to trend sideways, at least at the beginning.

I suspect continued consolidation is likely through at least the early part of next week,” he said. “I think the market may have exaggerated the likelihood of a 50 bp cut, let alone an emergency inter-meeting Fed cut. US coupon yields have firmed.”

Chandler said next week’s highlight will be the CPI report. “It is likely to be unchanged on year-over-year basis, which will meet the low bar of a Fed Sept cut (25 bp),” he said. “Note that China’s PBOC did not buy gold for the 3rd month in July after an 18-month buying spree.”

Still to come: Middle East tensions, and many still expect Iran to strike Israel, which would, at least initially, be supportive of gold,” he added.

Adrian Day, President of Adrian Day Asset Management, expects gold prices to move higher. “Market expectations for an interest rate cut by the Federal Reserve keep changing, and with them so does the gold price,” he observed. “But there is little doubt that there will be at least an initial rate cut in the near term, and that will be the signal for North American investors to become more interested in gold, especially as the U.S. economy shows signs of slipping into a recession.”

Until now, the gold price has been driven with very little interest from Western investors,” Day said, “but a cut from the Fed and ongoing cuts from other central banks will change that.”

Adam Button, head of currency strategy at Forexlive.com, is neutral on gold’s near-term prospects. “A double top at $2475 is competing with a series of higher lows,” he said. “We’ve also seen a speculative wash-out. I think that sets the stage for a week of calming and consolidation, but watch Wednesday’s CPI report closely as it’s likely to put the nail in the coffin of the inflation story.”

Sideways,” said Darin Newsom, Senior Market Analyst at Barchart.com. “While I still see Dec gold in an intermediate-term downtrend on its weekly chart, it remains range bound heading Into Friday's session.”

Heading into next week, resistance is at the previous 4-week high of $2,537.70 with support at the previous 4-week low of $2,398.20,” he said. “Granted that’s a wide $139.50 range, but that sometimes happens. The contract’s daily chart is providing little guidance, also indicating a sideways short-term trend early Friday morning.”

Sean Lusk, co-director of commercial hedging at Walsh Trading, said the gold market is changing so quickly these days that it’s difficult for traders to choose a direction.

You're living day to day, not week to week with this stuff,” Lusk said. “These gyrations, the swings in the market… check your position in another four hours and see what your opinion is, because it may change big time.”

Lusk said that since recession fears first flared up last week, they sent everything tumbling, and he still believes the U.S. employment situation is worse than the headline numbers. “The market is contracting in the private sector,” he said. “The job growth is pretty contained in government hiring, so that's not really sustainable. Longer term, that's the fear, but the emotion sometimes is out of whack versus reality.”

Lusk said Monday’s apocalyptic pessimism was just as overdone as the equity market’s irrational optimism that preceded it.

There were people screaming Monday morning that the Fed had to do a 75-point emergency cut,” he said. “It's just nonsense. For what? Where were we in January in the S&P 500? We closed last year at 4820, and we're 5359 currently. We have to have a crash in the market. You have to go negative, and this did not happen in the Dow or S&P. NASDAQ, different animal, but nothing goes up forever.”

Turning to gold’s price action, Lusk said he expects the yellow metal to remain strong, and while he doesn’t see another big move higher in the near term, he believes gold will run higher by year-end.

We hit $2,485, that was our target,” he said. “Now we're at $2,468 [in the December contract], and last Friday it was over twenty-five-hundred dollars, $2,522. Last Friday was the all-time high. Now you're only $50 away from there, which these days is nothing. But the next target up is going to be that $2,580 to $2,585 area, that's 25% higher on the year.”

They'll act in five percent increments,” Lusk added. “That's all they've done on this rally, by the way: take it up five, ten, fifteen, twenty percent higher on the year, get a little above it, pause, correction, break a hundred dollars, right back up, make new highs, repeat, consolidate, blah, blah, blah. New story comes in, run it up.”

This week, 10 analysts participated in the Kitco News Gold Survey, with the majority of Wall Street now expecting gold to settle into a consolidation pattern as bearish sentiment has completely evaporated. Six experts, or 60%, expect to see gold prices trending sideways during the week ahead, while the remaining 40% believe gold will post further gains next week. None predicted a decline in price for the precious metal.

Meanwhile, 210 votes were cast in Kitco’s online poll, with most Main Street investors maintaining their bullish outlook. 130 retail traders, or 62%, looked for gold prices to rise next week. Another 45, or 21%, expected the yellow metal to trade lower, while 35 respondents, representing the remaining 17%, saw prices consolidating during the week ahead.
After this week's virtually empty data calendar, market-moving news picks up once again. Next week's highlights include Tuesday's release of U.S. PPI for July, followed by U.S. CPI for July on Wednesday, July retail sales and weekly jobless claims on Thursday, and U.S. housing starts and building permits for July on Friday morning, followed by the preliminary University of Michigan consumer sentiment survey for August.

Markets will also pay attention to the Empire State and Philly Fed manufacturing indexes for August scheduled for release on Thursday morning.

And with attention now squarely focused on the prospect of a September rate cut from the Federal Reserve, precious metals investors will also be paying close attention to next week's slate of Fed speakers, including Bostic on Tuesday, Musalem and Harker on Thursday, and Goolsbee on Friday afternoon.

James Stanley, senior market strategist at Forex.com, expects to see gold prices rise next week. “Bulls are still in control and they illustrated that well over the past week,” he said. “The Monday spike-low led into a higher-low on Tuesday and buyers came back in a big way in the latter part of the week.”

In my view they have an open door to re-test highs but there still hasn’t been any clear evidence that they’re ready to take out $2500 yet,” Stanley said. “If they can break the pattern of lower-highs in spot Gold on the daily chart, that door for the $2500 test widens significantly. The risk to this scenario would be Treasury yields around the CPI report next week as a rush for yield can see capital flee gold to chase yield.”

Everett Millman, Chief Market Analyst at Gainesville Coins, said that he expects August’s seasonal favorability to support gold despite the geopolitical and market turmoil.

Millman said gold’s sharp drop was expected during Monday’s market decline. “Somewhat counterintuitively, it's actually the standard response that we see from the precious metals when other markets are selling off,” he said. “It's just that gold is very liquid, it's easy to sell and it's the first thing to go when risk assets are selling off the first move tends to be lower for gold. That's why it didn't surprise me because hedge funds and wealth management firms have to sell something to recoup their losses.”

Millman said that seasonally, August is one of the best months for gold, and markets are now looking ahead to a September rate cut from the Fed.

It seems to be set in stone that everyone's expecting it,” he said. “They may not cut rates as much as some people are howling for right now, but it seems the Fed is going to start cutting in September, and that's good for gold.”

While Millman expects a fair amount of front running of the rate cut throughout the month of August, he doesn’t see a big price increase. “I don't expect any major moves higher,” he said. “I would expect gold to continue sideways with a bit of a bias toward trading higher.”

Really, anything holding above support at $2,400 should be cheered massively by the bulls,” he added. “Gold still is up a ton this year, so they can only be happy with where we're already at. $2,500, up to $2,700, I wouldn't expect to see any of that until at least September.”

The one thing that Millman believes could drive gold to new highs ahead of schedule is an escalation in the Middle East. “The biggest thing would be if Iran finally retaliates,” he said. “The biggest concern is that if the conflict spreads, that more countries are roped into it, and then you get a wider war, and everyone has to line up and pick sides.”

I think that's definitely a risk that would drive gold higher,” he concluded.

This is now bullish,” said Michael Moor, Founder of Moor Analytics. “Decent trade back above 24979 (+3.5 tics per/hour starting at 7:00am) should bring in decent strength. Decent trade above 25123 (-.6 of a tic per/hour starting at 7:00am) will project this upward $110 (+). A maintained gap higher will leave a minor bullish reversal below. Decent trade below 24316 (+3 tics per/hour) will project this downward $40 (+).”

And Kitco Senior Analyst Jim Wyckoff sees technical and fundamental drivers favoring price gains next week. “Steady-higher as charts remain bullish and geopolitics simmering,” he said.

At the time of writing, spot gold last traded at $2,423.78 per ounce for a gain of 0.14% on the day, but a loss of 0.46% on the week.
Kitco Media

Ernest Hoffman

Time to Buy Gold and Silver

Tim Moseley

Gold Defies Headwinds of Dollar Strength Higher Yields and Jobless Claims

Gold Defies Headwinds of Dollar Strength, Higher Yields, and Jobless Claims

Amidst a confluence of factors typically bearish for the precious metal, gold prices managed to post solid gains on Thursday. This resilience in the face of economic data and market dynamics that would normally weigh on the yellow metal suggests the recent price correction may be nearing its end.

According to the U.S. Labor Department, initial jobless claims fell to 233,000 last week, down from 249,000 the prior week and below the 240,000-consensus forecast. This decline in new unemployment filings is generally seen as a positive economic indicator, one that would normally put downward pressure on safe-haven assets like gold.

Similarly, the U.S. dollar gained 0.05% on the day, reaching an index level of 103.01. A stronger dollar tends to make gold, which is priced in the U.S. currency, more expensive for foreign buyers, thereby reducing demand. Treasury yields also rose, with the 2-year note climbing 9.3 basis points to 4.061% and the 10-year note gaining 5.2 basis points to 4.018%. Higher yields make non-yielding gold less attractive in comparison.

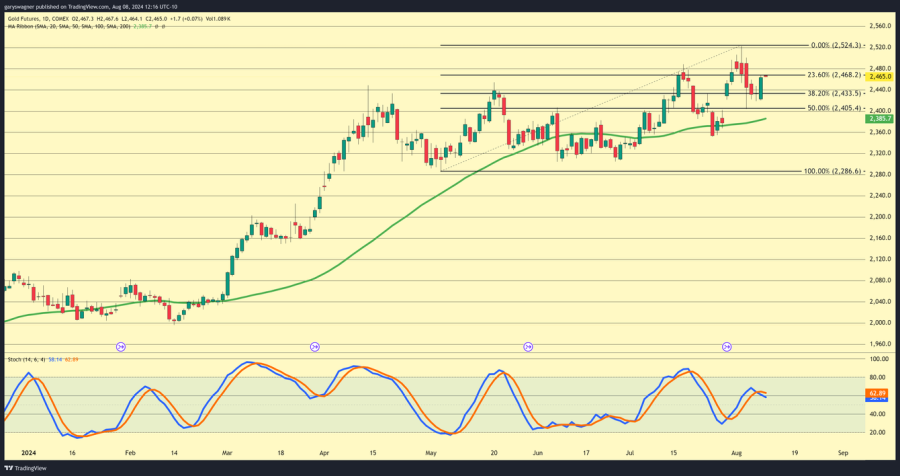
Typically, the combination of a stronger dollar, higher yields, and improving employment data would be enough to send gold prices lower. Yet, defying these typical market dynamics, gold for December delivery settled $30.90 higher at $2,463.30 per ounce, a 1.27% increase.

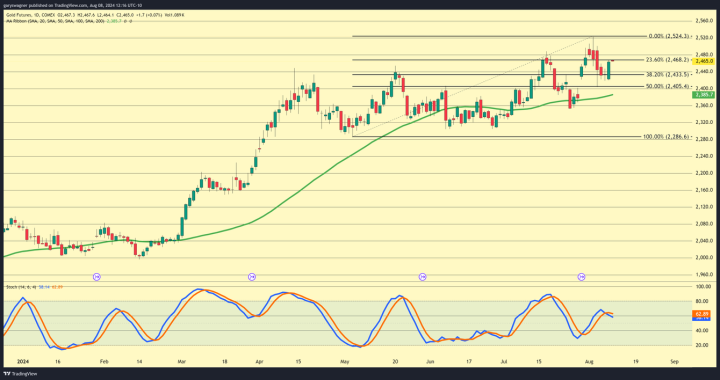
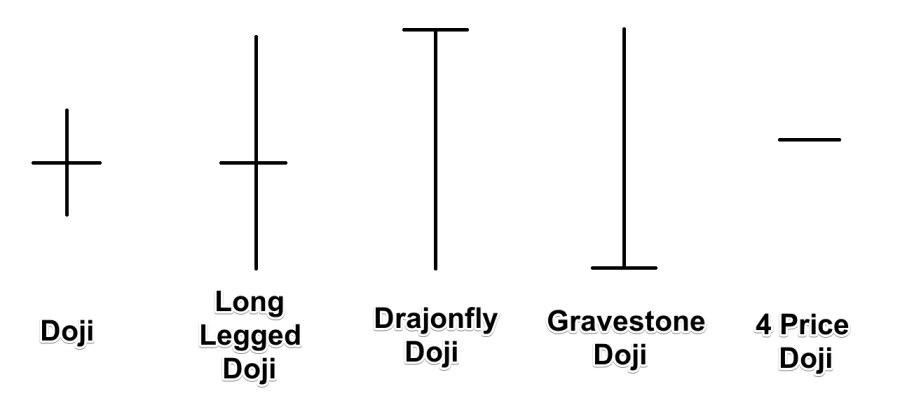
This resilience was foreshadowed on Wednesday, when gold futures traded largely unchanged, closing just $0.20 below the opening price. This price action created a Japanese candlestick pattern known as a "doji," which occurs when a commodity or stock opens and closes at virtually the same price. To Eastern technical analysts, the doji candlestick can signal a potential key-reversal or pause in a trend.

The fact that gold was able to rebound strongly in the face of these apparent headwinds suggests the recent price correction may be drawing to a close. Over the past several weeks, gold had declined from its August highs near $2,500 per ounce, leading some to wonder if the precious metal's remarkable rally since the start of 2023 was running out of steam.

However, Thursday's performance, combined with the preceding doji candlestick, indicates that gold may be finding its footing. The ability to advance in the face of a stronger dollar, higher yields, and improving economic data points to underlying strength and resilience in the gold market.

For those who would like more information simply click on one of the links below:

Information, Track Record, Trading system, Testimonials, Free trial

Wishing you as always good trading,

Kitco Media

Gary Wagner

Time to Buy Gold and Silver

Tim Moseley
US dollar is ‘the biggest asset bubble’ all roads lead to more money printing – Mark Moss

U.S. dollar is 'the biggest asset bubble,' all roads lead to more money printing – Mark Moss

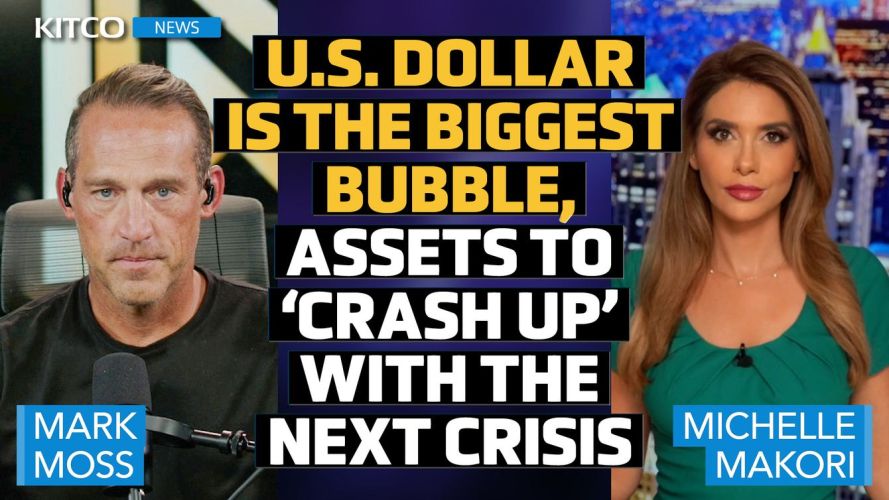
The inevitable consequences of a recession in the U.S. are more money printing, liquidity injections and inflation, according to Mark Moss, Host of 'The Mark Moss Show' and Partner of the Bitcoin Opportunity Fund, who warns that the U.S. dollar is the biggest asset bubble.

"We're in the situation where all roads lead to more government printing and more inflation," Moss told Michelle Makori, Lead Anchor and Editor-in-Chief at Kitco News. "If we were to have a recession, that just means more inflation … The Fed is between the rock and the hard place; there's no way out. The government cannot afford a recession. Typically, when we see a recession, we see tax receipts drop by somewhere between 12 to 15%. They can't afford that."


There's a big difference between a recession and how asset prices perform, Moss noted, saying that the Fed will inevitably inject more liquidity into the economy, causing asset prices to "crash up" due to devaluation and debasement of the U.S. dollar's purchasing power.

For insights on Moss' 'crash up' theory, watch the video above.

He explained that it all comes down to the fact that the U.S. is running on a debt-based monetary system, with the national debt now surpassing $35 trillion.

"Money is created through debt issuance. That means the dollar is a liability, and the debt is an asset. Then, it becomes collateral for more debt. The problem is that if these asset prices start to fall, then there's not enough collateral for the other debt that's out there. And that will cause a massive downward spiral that we could not handle," Moss said.

This cycle ultimately leads to more liquidity injections into the economy, with more money ending up in assets like equities, real estate, Bitcoin, and gold.

We know that the S&P 500 moves up exactly like the global liquidity,” Moss noted. “Gold has a sensitivity ratio of 1.49. So that means for every 10% rise in liquidity, gold goes up by 14%. Bitcoin has an 8.95 sensitivity, which means for every 10% rise in liquidity, Bitcoin goes up by 90%.”

Moss also pointed out that individuals do not really own anything in a debt-based monetary system. “The money in the bank is legally not your money. That money is owed to you. Stocks – you don't actually own those legally, your broker owes them to you. The house that you've paid off, you don't really own that. You have to pay monthly to the County assessor, or they take that from you,” Moss stated.

Watch the video above for his explanation how the debt-based monetary system works.

Perhaps the biggest issue for investors is the state of the U.S. dollar. Moss stated that as the dollar continues to lose its purchasing power, it creates an illusion of asset price bubbles forming in areas like real estate and stocks. However, the real bubble lies in the dollar's value.

"It's not that stocks are in a bubble or homes are in a bubble. It's the dollars that are in a bubble," he said. "We're looking at the underlying denominator – the U S dollars – a manipulated denominator. We're not realizing the bubble is actually in the denominator – the dollars."


For more on Moss' "dollar is the biggest asset bubble" theory, watch the video above.

What's next for Bitcoin?

If former President Donald Trump wins the election, Moss sees Bitcoin hitting $400k towards the end of 2025. For his more precise timeline and Bitcoin price forecast for the end of this year, the start of 2025, and the longer term, watch the video above for insights.


This video is brought to you by Swan Bitcoin:

Swan Bitcoin IRA – Start Saving Now 👉 https://Swan.com/retire
 

Kitco Media

Anna Golubova

Time to Buy Gold and Silver

Tim Moseley
Gold Market Experiences Fourth Consecutive Day of Decline

Gold Market Experiences Fourth Consecutive Day of Decline


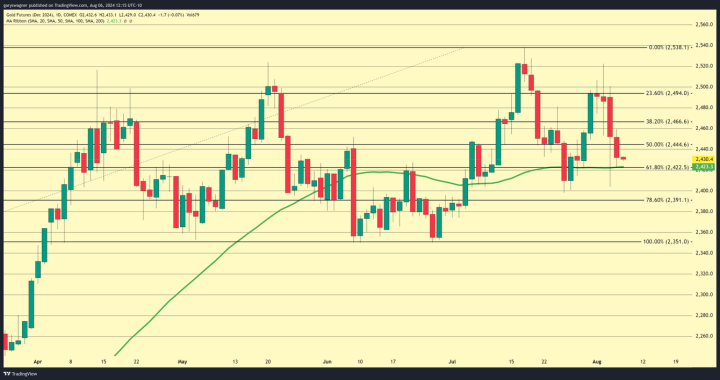
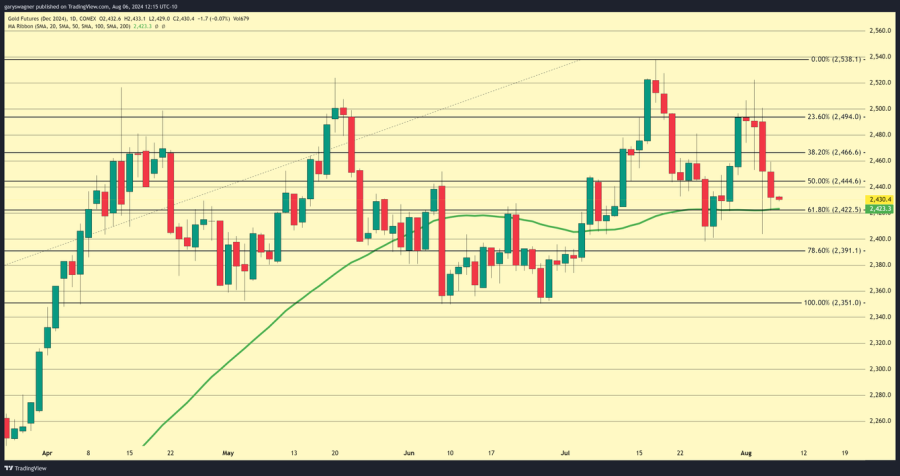
The gold market has been experiencing a turbulent period in August, with prices declining for the fourth consecutive trading session. This downward trend began on August 1, when the December gold contract decline by the fractional amount of $2.50, after opening at $2,493.40. As of the latest report, the most active December contract has fallen to $2,432.10, representing a significant drop of $20. Gold is currently trading in Australia down an additional -$1.50, taking December gold to $2429.80

The recent decline in gold prices can be attributed to several factors, including concerns about a potential U.S. economic recession and fluctuations in Treasury yields. The latest jobs report revealed an increase in the unemployment rate to 4.3%, its highest level since October 2021, fueling worries about the economy's health.


U.S. Treasury yields have also played a role in gold's recent performance. The two-year note yield rose by 7.9 basis points to 4.016%, while the 10-year Treasury note yield increased by 11 basis points to 3.908%. These changes in bond yields, coupled with a slight strengthening of the U.S. dollar index (up 0.15% to 102.685), have contributed to the downward pressure on gold prices.

The economic uncertainty has led to increased speculation about the Federal Reserve's upcoming monetary policy decisions. The probability of a more aggressive rate cut at the September Federal Open Market Committee (FOMC) meeting has risen dramatically. Just one month ago, the likelihood of a 0.5% rate cut was only 5.5%. However, this probability surged to 85% yesterday before settling at 71.5% today.


According to the CME's FedWatch tool, which analyzes interest rate futures to predict monetary policy changes, there is now a 100% certainty of a rate cut next month. The tool suggests a 71.5% chance of a 0.5% cut and a 28.5% probability of a more modest 0.25% reduction.

These market dynamics highlight the complex interplay between economic indicators, monetary policy expectations, and precious metal prices. As investors and traders navigate this uncertain landscape, they must consider a range of factors, including employment data, Treasury yields, dollar strength, and potential Federal Reserve actions.


The gold market's recent volatility serves as a reminder of the metal's sensitivity to economic conditions and policy shifts. As the September FOMC meeting approaches, market participants will be closely monitoring further economic data and policy signals to gauge the future direction of gold prices and the broader financial markets.


For those who would like more information simply click on one of the links below:


Information, Track Record, Trading system, Testimonials, Free trial

Wishing you as always good trading,

Kitco Media

Gary Wagner

Time to Buy Gold and Silver

Tim Moseley