Tag Archives: kinesis money system

Gold solidly down on profit taking rebound in USDX

Gold solidly down on profit taking, rebound in USDX

Gold prices are sharply lower in midday U.S. trading Monday, on some profit-taking pressure from the shorter-term futures traders and as the U.S. dollar index is solidly up today, on a rebound after last week hitting a two-month low. Silver prices are just modestly down. Still, both metals are in firmly bullish technical postures to suggest more upside for prices in the near term. April gold was last down $22.70 at $1,989.20 and May silver is down $0.133 at $24.955.

Global stock markets were mixed overnight. U.S. stock indexes are a bit weaker near midday. It’s a calmer start to the trading week, following a three-day holiday weekend for most traders and investors. The U.S. Labor Department’s March jobs report issued Friday morning came in about as expected, showing a non-farm payrolls rise of 236,000 jobs versus a gain of 311,000 in the February report. Still, Friday’s jobs numbers fall into the camp of the U.S. monetary policy hawks, who want to see further interest rate increases from the Federal Reserve.

The U.S. data point of the week will be Wednesday morning’s consumer price index report for March, which is expected to show an annual rise of 5.1%, compared to a rise of 6.0% in the February report.

  Bank of America is looking for $2,100 gold price by Q2

The key outside markets today see the U.S. dollar index sharply up. Nymex crude oil prices are slightly down and trading around $80.50 a barrel. The benchmark 10-year U.S. Treasury note yield is presently fetching 3.4%.

Technically, April gold futures prices hit a 12-month high last week. Bulls still have the solid overall near-term technical advantage. Prices are in an uptrend on the daily bar chart. Bulls’ next upside price objective is to produce a close above solid resistance at the all-time high of $2,078.80, scored in March of 2022. Bears' next near-term downside price objective is pushing futures prices below solid technical support at $1,900.00. First resistance is seen at $2,000.00 and then at today’s high of $2,006.60. First support is seen at $1,975.00 and then at $1,965.00. Wyckoff's Market Rating: 8.0

May silver futures prices hit a 12-month high last week. The silver bulls have the solid overall near-term technical advantage. Prices are in a steep uptrend on the daily bar chart. Silver bulls' next upside price objective is closing prices above solid technical resistance at $27.50. The next downside price objective for the bears is closing prices below solid support at $23.00. First resistance is seen at last week’s high of $25.295 and then at $25.50. Next support is seen at $24.50 and then at $24.25. Wyckoff's Market Rating: 8.0.

May N.Y. copper closed down 440 points at 397.15 cents today. Prices closed near the session low today. The copper bulls have the slight overall near-term technical advantage but have faded recently. Copper bulls' next upside price objective is pushing and closing prices above solid technical resistance at the March high of 417.45 cents. The next downside price objective for the bears is closing prices below solid technical support at the March low of 382.20 cents. First resistance is seen at today’s high of 403.95 cents and then at 407.15 cents. First support is seen at last week’s low of 399.60 cents and then at 392.60 cents. Wyckoff's Market Rating: 5.5.

By

Jim Wyckoff

For Kitco News

Time to Buy Gold and Silver

Tim Moseley

GoldSilver: The critical indicator every silver trader is watching

Gold/Silver: The critical indicator every silver trader is watching

Happy Easter to all of you, and with Good Friday here, the markets enjoy an early close after the release of the monthly Nonfarm payroll report. The number narrowly beat expectations showing an increase of 236,000 jobs, and the initial reaction gave a favorable boost to the U.S. Dollar and Treasury Yields. Unfortunately, the Precious Metals markets are closed today, leaving Sunday night as a possible "volatility event" as the markets try to price what a stronger report will mean for the Fed at their next meeting. Looking back from the lows in March, Gold has rallied $200 and Silver over $5, leaving both markets susceptible to a correction. For those currently long, we will continue to lift protective stop losses and use options to add to positions while concentrating on "undervalued" metals such as Copper and Platinum.

Daily May Silver Chart

The technical backdrop shows Silver extending the "Bull flag pattern" we identified several weeks back while continuing to achieve new swing highs and breaking through the consolidation zone seen from December through February. We remain cautiously optimistic as most technical indicators show the market substantially "overbought," as seen through the slow stochastic indicator. The eight-day exponential moving average (EMA) has worked exceptionally well in helping Silver traders from a risk management standpoint and looking to exit their positions on the first close below. Traders will then wait to see if an extended selloff occurs by analyzing if a crossover occurs with the eight-day EMA crossing below the thirty-four-day EMA. If that event happens, we could be setting up for a multi-week correction.

To further help you develop a trading plan, I went back through 20 years of my trading strategies to create a Free New "5-Step Technical Analysis Guide to Gold that can easily apply to Silver." The guide will provide you with all the Technical analysis steps to create an actionable plan used as a foundation for entering and exiting the market. You can request yours here: 5-Step Technical Analysis Guide to Silver.

Daily June Gold Chart

The technical backdrop in Gold shows a different picture from Silver as the market successfully "broke out" from the "Bull Flag" pattern we identified in last week's article. However, without a continuation above $2050, traders should use any close below $2000 as the first warning sign that a correction could be brewing. A critical level we are watching is the March 21st downward spike low to 1965.9, now the first significant support. A break below 1965.9 will begin signaling a near-term failure. Therefore, we would be only cautiously Bullish and reevaluating upon such a move. For those working closely with us, most of you are working stops below the $1955 level on a "Good till Cancelled" basis.

Having the flexibility to enter and exit the market quickly makes it essential for Precious Metals investors to have a futures trading account alongside their core Physical Precious Metals holdings. If you are interested in speculating on the rise and fall of the price of Precious Metals on a shorter-term basis, such as two weeks or two months, or If you have never traded futures or commodities, I just completed a new educational guide that answers all your questions on transferring your current investing skills into trading "real assets," such as the 1000 oz Silver futures contract. You can request yours here: Trade Metals, Transition your Experience Book.

By

Phillip Streible

Contributing to kitco.com

Time to Buy Gold and Silver

Tim Moseley

Gold futures consolidate forming a base at recent highs above 2030

Gold futures consolidate forming a base at recent highs above $2030

The solid breakout that moved gold futures above $2000 to a high of $2043 yesterday, and $2049.20 today indicates a new level of support well above $2000 per ounce.

Currently, the most active June 2023 futures contract is fixed at $2037.10 a net decline of $1.1 or 0.05%. The fact that gold did not immediately sell off as it has in the past after hitting the highest price since gold hit $2077 last year indicates strong bullish market sentiment that continues to drive gold higher and more importantly hold those recent high prices.

Today’s fractional decline occurs with dollar strength which indicates that there are still traders bidding the precious metal higher although not enough to take gold futures higher on the day.

The same cannot be said for spot gold which is currently fixed at $2020 which is a net gain of $0.30. According to the Kitco Gold Index (KGX), today’s spot prices are a combination of investors bidding spot gold higher by $6.60 coupled with dollar strength taking gold lower by $6.30, thereby creating a fractional gain of $0.30. The dollar is currently up 0.30% and the index is fixed at 101.57.

The force that propelled gold well above $2000 yesterday was weaker U.S. economic data. The data suggested that the Federal Reserve could certainly consider slower rate hikes and a pause of rate hikes sooner. According to the CME’s FedWatch tool, there is a 55.9% probability that the Federal Reserve will not raise rates at the May FOMC meeting and begin to pause raising rates as they assess whether their former rate hikes indicate that their actions have put inflation on a firm trajectory towards their target of 2%.

The next key event that will shape the Federal Reserve’s decision will be Friday’s jobs report. This is because the Federal Reserve is laser-focused on the extremely robust labor market as a strong higher inflationary component.

On a technical basis, there is no resistance until $2069 the highest closing price for gold futures on record. With a short-term bias, you can use today’s low of $2026 as a potential solid support level.

By

Gary Wagner

Contributing to kitco.com

Time to Buy Gold and Silver

Tim Moseley

Breakout in gold takes futures to a high of 204340 in striking range of record high

Breakout in gold takes futures to a high of $2043.40 in striking range of record high

A solid breakout in gold moved futures pricing well above $2000 in trading today. Currently, the most active June 2023 contract is trading up $39.10 or 1.94% and fixed at $2039.40. That puts gold within striking range of the all-time high of $2088 as well as the record closing price for gold futures at $2069.40.

Dollar weakness contributed roughly 25% of the gains in gold today but it was market participants actively bidding the precious yellow metal higher that caused this current rally to accelerate. The dollar is currently down 0.53% and the dollar index is fixed at 101.25.

The primary fundamental event that propelled gold well above $2000 was weaker U.S. economic data. This data suggests that the Federal Reserve could certainly consider slower rate hikes and a pause of rate hikes sooner.

For the first time since May 2021, available new job positions have dropped below 10 million. Today CNBC reported that "Job openings fell below 10 million in February for the first time in nearly two years, in a sign that the Federal Reserve's efforts to slow the labor market may be having some impact. Available positions totaled 9.93 million, a drop of 632,000 from January's downwardly revised number, the Labor Department reported Tuesday in its monthly Job Openings and Labor Turnover Survey."

Because the Federal Reserve has been laser-focused on the extremely robust labor market as it uses its tools to reduce inflation today's report confirms that recent action by the Federal Reserve is beginning to have an impact as seen in the contraction of job openings.

The probability that the Federal Reserve will not raise rates at the May FOMC meeting has increased dramatically. According to the CME's FedWatch tool, there is a 58.7% probability that the Federal Reserve will leave its terminal rates of 4.75% to 5% and beginning a period of pausing rate hikes. However, there remains a 41.3% probability that the Fed will raise rates by ¼% in May.

There is no technical resistance in gold futures until $2069 the highest closing price for gold futures on record. There is solid support for gold at $2013 which is the 38.2% Fibonacci retracement of the most recent leg of the rally. In other words, there is a high probability that gold futures will not only hold above $2000 but challenge the all-time record close.

By

Gary Wagner

Contributing to kitco.com

Time to Buy Gold and Silver

Tim Moseley

Gold price sees triple-digit gains in March but can it set record highs in April?

Gold price sees triple-digit gains in March, but can it set record highs in April?

Gold gained $150 in March — its best month since July 2020. And with analysts seeing markets contradicting the Fed's messaging, gold has a lot more upside, including testing and breaking record highs in April, according to analysts.

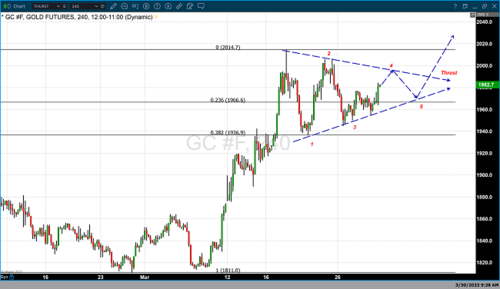
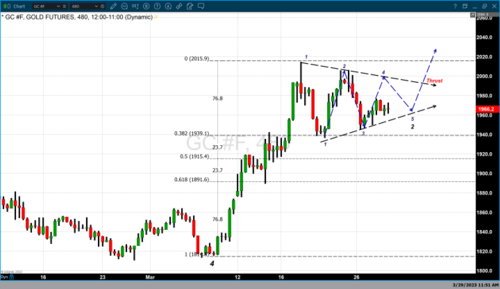
The gold market is wrapping up March just below $2,000 an ounce. This is up 7% on the month and 9% year-to-date — the best monthly performance since July 2020 and the best quarterly result since Q2 2020.

The collapse of Silicon Valley Bank three weeks ago triggered the banking crisis, which revised the markets' Federal Reserve outlook from more rate hikes to rate cuts.

"This could morph into a financial crisis. There's been a large decline in market values of assets on the books across the regional banking sector in a significantly tighter environment. Not only was there a loss of market value but also large outflows of deposits from less restrictive to more restrictive banks," TD Securities global head of commodity strategy Bart Melek told Kitco News. "The Fed is less likely to be overly hawkish as we move into 2023."

And even with turbulence subsiding, gold is still trading at higher levels. "Gold hasn't come back down very far even though banking fears are abating for the moment. This is a strong sign and is very encouraging for gold bulls," Gainesville Coins precious metals expert Everett Millman told Kitco News.

Even though the Fed has not signaled that it is debating a rate cut, markets are starting to price that in. "With the bank space turbulence and inflation pointing down, I suspect that the market is looking past a lot of the Fed's hawkish rhetoric and is calling for a pivot that is significantly ahead of the dot plots," Melek pointed out.

Investors should pay close attention to the incoming data as any weaker-than-expected number increases the chance of a rate cut this year.

"With the risk of a hard landing for the economy on the rise, this increases the chances that inflation will fall more quickly and allow the Fed to respond with interest rate cuts before the end of this year," said ING chief international economist James Knightley.

Next week, traders will be getting the March employment report. Market consensus calls are projecting for the U.S. economy to have added 240,000 jobs and for the unemployment rate to have remained at 3.6%.

Following March events, TD Securities is now projecting gold to average $1,975 in Q2, $2,050 in Q3, and $2,100 in Q4.

Gold's first week of April

The gold space could experience some losses in the short term, warned Millman. "There is some downside risk. A relief rally in equities can drive some money out of gold," he said.

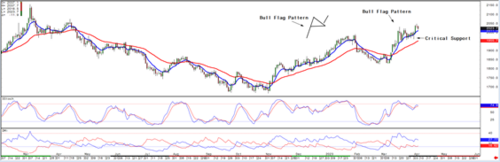
A solid support level is around $1,900 and $1,850, and immediate resistance is at $2,000 an ounce and then $2,060-70, he said.

"When you look at the shorts vs. longs in gold futures, the sentiment is still fairly neutral. If you see some swing in public perception, what's happening with the dollar or the U.S. economy, it could swing sentiment, and gold would be the first to react to that," Millman noted.

Banking crisis

It is unclear whether the volatility in the banking sector is over. But all the extra lending overseen by the Fed is yet to slow down, said Bannockburn Global Forex chief market strategist Marc Chandler.

"The banking stress that roiled the markets this month has eased. However, the emergency lending by the Federal Reserve, via the discount window and the new Bank Term Funding Program hardly slowed in the past week ($152.6 bln vs. $163.9 bln)," Chandler said Friday.

Barclays warned that the banking crisis is likely far from over, as a "second wave" of deposit outflows is coming.

"We think the first wave of outflows may be nearly over … But the recent tumult regarding deposit safety may have awakened 'sleepy' depositors and started what we believe will be a second wave of deposit departures, with balances moving into money market funds," Barclays strategist Joseph Abate said in a note.

A second wave of outflows is likely to be triggered by "sleepy" depositors moving their savings from banks to money-market funds for better and safer returns, Abate clarified.

"It is too hard to shift balances or to establish a new relationship with another institution unless there is a large, convincing yield pickup. But some of it could reflect the fact that after 15 years of near-zero rates, depositors are not in the habit of paying much attention to the yield on their cash balances," Abate said.


Next week's data

Monday: ISM manufacturing PMI

Tuesday: U.S. factory orders

Wednesday: U.S. ADP nonfarm employment, ISM services PMI

Thursday: U.S. jobless claims

Friday: U.S. nonfarm payrolls

By

Anna Golubova

For Kitco News

Time to Buy Gold and Silver

Tim Moseley

Gold’s most active contract switches to June which are flirting with 2000

Gold’s most active contract switches to June which are flirting with $2000

Gold traded higher by low double digits today. The gains are the result of two factors and tomorrow’s PCE inflation report. Currently, the April 2023 contract of gold futures is trading up $14.20 and fixed at $1981.10. Concurrently, the June 2023 contract of gold futures is fixed at $1998 up $13.50. Today the June contract hit an intraday high of $2002.40.

The volume is diminishing in the April contract with an open interest of 88,563. The volume in the June contract has an open interest of 145,716. Traders are switching from the April contract to the June contract which is next in line to be the most active.

The dollar is currently trading lower by 0.43% and the dollar index is fixed at 101.86. The dollar has had a strong decline since October of last year when the index traded to an intraday high of 114. It seems that the days of extreme dollar strength have greatly diminished and we anticipate that the dollar index could break below 100.

Yields on government bonds are also lower which has greatly enhanced the demand for gold as a haven asset. Gains in U.S. equities did little to diminish demand for the haven assets and did not seem to have any detrimental effect on Gold pricing today.

As we spoke about yesterday, market participants who are anticipating a Fed pivot from raising rates to cutting rates have been largely disappointed. It is accepted by analysts and economists that the Federal Reserve will continue to either raise rates or pause rates at some point soon.

The CME’s FedWatch tool indicates that professional traders are almost split between anticipating a ¼% rate hike or a pause in interest rate hikes at the next FOMC meeting which begins around a month from today and concludes on May 3. According to the CME’s probability indicator, there is a 43.6% probability that the Federal Reserve will pause its hawkish monetary policy of raising rates at each FOMC meeting, and a 56.4% probability that the Fed will raise rates by ¼%. Yesterday the CME’s FedWatch tool indicated that there was a 67.4% probability that the Fed would pause rates with a 37.6% probability of a ¼% rate hike. This is a pretty dramatic shift in the last 24 hours.

Lastly, the preferred inflation indicator of the Federal Reserve, the PCE (Personal Consumption Expenditures Price Index) will be released tomorrow, March 31. Currently, forecasters believe that inflation levels will remain elevated. If the PCE does remain elevated as currently predicted it could strengthen the resolve of the Federal Reserve to raise rates rather than take a pause.

By

Gary Wagner

Contributing to kitco.com

Time to Buy Gold and Silver

Tim Moseley

Gold remains solidly bullish even with today’s modest price decline

Gold remains solidly bullish even with today’s modest price decline

Although gold prices had a modest decline in trading today, the overall fundamental environment that had caused gold pricing to trade above $2000 last week remains solidly entrenched. Today’s modest single-digit decline in gold resulted from market participants once again focusing on risk-on assets with U.S. equities rising. Specifically, a major rise of 1.97% in the NASDAQ composite indicates solid interest in the tech-heavy index. The Dow Jones industrial average gained 1% and the S&P 500 increased by 1.42%.

Positive market sentiment for US equities coupled with minor dollar strength could have easily tipped traders to take profits on long positions in gold. As of 5:25 PM EST gold futures basis the most active April contract is down $7.30 or 0.37% and fixed at $1966.20.


However, June gold futures which will be the next most active contract is currently fixed at $1983.10 booking the same dollar decline of $7.30 but are priced almost $20 above the April contract. The large differential of almost $20 between the two contract months clearly illustrates market sentiment is exceedingly bullish long-term for gold.

Market participants who were anticipating a Fed pivot from raising rates to cutting rates have been largely disappointed. However, it must be noted that the CME’s FedWatch tool indicates that professional traders are anticipating a pause in rate hikes in 34 days when the Federal Reserve concludes its May FOMC meeting on May 3, 2023. According to the CME’s probability indicator, there is a 67.4% probability that the Federal Reserve will not raise rates and a 37.6% probability that they will implement another 25 bps rate hike.

Lastly, the preferred inflation indicator of the Federal Reserve, the PCE (Personal Consumption Expenditures Price Index) will be released this Friday, March 31. Currently forecasts believe that inflation levels will remain elevated. If the PCE remains elevated as currently predicted it could pressure the Federal Reserve to raise rates rather than take a pause at the May FOMC meeting.

By

Gary Wagner

Time to Buy Gold and Silver

Tim Moseley

Gold silver gain on bargain hunting bullish outside mkts

Gold, silver gain on bargain hunting, bullish outside mkts

Get all the essential market news and expert opinions in one place with our daily newsletter. Receive a comprehensive recap of the day's top stories directly to your inbox. Sign up here!

(Kitco News) – Gold and silver prices are up in midday U.S. trading Tuesday on some perceived bargain hunting, and amid a lower U.S. dollar index and higher crude oil prices on this day. April gold was last up $15.00 at $1,968.70 and May silver was up $0.21 at $23.355.

The key outside markets today see the U.S. dollar index lower and continuing to trend lower on the daily bar chart. Nymex crude oil futures prices are up and trading around $73.50 a barrel. Oil prices have made a good rebound from the March low and bulls are working on a price uptrend on the daily bar chart. Meantime, the benchmark 10-year U.S. Treasury note yield is presently fetching 3.558%.

Global stock markets were mixed overnight. U.S. stock indexes are mixed at midday. The U.S. and European banking crisis appears to have stabilized, at least for now. That’s allowing risk appetite to creep back into the marketplace. Continued easing worries about the banking crisis, and a continued uptick in risk appetite, would very likely cap gains in gold and silver prices for the near term.

  Fed's 'Emergency rate cut' by June to precede 'controlled implosion' of banking sector, only 6 banks left as CBDCs rolled out by 2025 – Edward Dowd

It’s a busy week for U.S. economic data, but the highlight is Friday’s personal consumption and expenditures (PCE) data that will provide fresh clues on inflation and whether the U.S. economy is headed toward recession. It’s been said the PCE data is a favorite gauge of inflation for the Federal Reserve.

Technically, April gold futures bulls have the solid overall near-term technical advantage. Prices are still in an uptrend on the daily bar chart. Bulls’ next upside price objective is to produce a close above solid resistance at the March high of $2,014.90. Bears' next near-term downside price objective is pushing futures prices below solid technical support at $1,900.00. First resistance is seen at this week’s high of $1,984.00 and then at $2,000.00. First support is seen at this week’s low of $1,945.00 and then at last week’s low of $1,936.50. Wyckoff's Market Rating: 7.5

]

May silver futures bulls have the firm overall near-term technical advantage. Prices are in a steep uptrend on the daily bar chart. Silver bulls' next upside price objective is closing prices above solid technical resistance at $24.00. The next downside price objective for the bears is closing prices below solid support at $22.00. First resistance is seen at this week’s high of $23.485 and then at last week’s high of $23.705. Next support is seen at today’s low of $22.96 and then at $22.50. Wyckoff's Market Rating: 7.0.

May N.Y. copper closed up 105 points at 408.90 cents today. Prices closed near mid-range today. The copper bulls have the overall near-term technical advantage. Copper bulls' next upside price objective is pushing and closing prices above solid technical resistance at the January high of 435.90 cents. The next downside price objective for the bears is closing prices below solid technical support at the March low of 382.20 cents. First resistance is seen at last week’s high of 414.85 cents and then at the March high of 417.85 cents. First support is seen at this week’s low of 402.35 cents and then at 400.00 cents. Wyckoff's Market Rating: 6.0.

By

Jim Wyckoff

For Kitco News

Time to Buy Gold and Silver

Tim Moseley

Gold prices soften as concern subsides over banking meltdown

Gold prices soften as concern subsides over banking meltdown

For the second consecutive day gold futures have traded lower. Today gold traded to an intraday low of $1945 and a high of $1984 after opening at $1982.60. As of 4:15 PM EST gold futures basis the most active April contract is currently fixed at $1958.50 after factoring in today’s decline of $25.30 or -1.28%.

Today’s decline of approximately 1.3% was the direct result of traders bidding the precious yellow metal lower, with dollar weakness providing tailwinds that softened the decline today. Dollar weakness also provided some relief for spot gold which is currently fixed at $1956.90 after factoring in a decline today of $21.30. However, before factoring in dollar weakness spot gold was trading lower by $26.60 with dollar weakness adding back $5.30 per ounce.

The primary factor that had increased demand for the precious metal diminished over the weekend. The concern was centered around a banking crisis involving Silicon Valley Bank and Signature Bank of New York spreading to other banks.

Over the weekend it was announced that First Citizens Bank reached a deal to purchase the Silicon Valley Bank in Santa Clara. The SVB was closed by California authorities on Friday, March 10. On Sunday, March 26 the FDIC (Federal Deposit Insurance Corporation) announced that the First Citizens Bank & Trust Company of Raleigh, North Carolina had completed a purchase agreement from deposits and loans of the Silicon Valley Bridge Bank.

The purchase of SVB greatly alleviated the fears that the banking meltdown would have a contagion effect leading to more banks becoming insolvent. This diminished the demand for safe-haven assets as investors reallocated funds from haven assets to risk-on assets such as U.S. equities. The Dow Jones Industrial Average gained 0.60%, and the S&P 500 gained 0.16%. However, bearish market sentiment continues in the tech-heavy NASDAQ composite which declined by 0.47%.

The two-day decline witnessed in gold could be short-lived as market participants focus on statements made by the Federal Reserve last week. For the first time since the Federal Reserve began raising rates, it indicated that its forward monetary policy is about to begin pausing interest rate hikes. Currently, it is anticipated that the Fed will initiate one more ¼% rate hike in May and then begin to pause rate hikes and assess the long-term impacts on inflation from their flurry of rate hikes which began in March 2022.

The Fed continues to maintain that its current terminal rate will remain elevated but a pause in hikes is the next best thing to a rate cut. Rate cuts were something which Chairman Powell emphatically stated is not something the Federal Reserve will implement without substantial data confirming that inflation is on a sustained downward trajectory towards their 2% target.

Gary S. Wagner

Time to Buy Gold and Silver

Tim Moseley

Gold’s bullish uptrend won’t be reversed by a ‘mean washout’ – analysts

Gold's bullish uptrend won't be reversed by a 'mean washout' – analysts

The gold market retreated Friday as better-than-expected U.S. data and hawkish comments from St. Louis Fed President James Bullard weighed on prices. But analysts don't see the gold's bullish uptrend reversing soon.

Gold was down around $15 on the day after hitting a high of $2,006.50 earlier in the session. After seeing its best gains in three years last week, gold continues its move higher, testing the $2,000 an ounce level a few times this week. At the time of writing, April Comex gold futures were trading at $1,980.50, down 0.77% on the day.

Gold began to decline Friday after the preliminary U.S. manufacturing and service-sector sentiment data beat expectations for March. The flash U.S. manufacturing Purchasing Managers (PMI) Index advanced to 49.3, marking a five-month high. And the service sector saw the PMI reading jump to 53.8 in March, marking an 11-month high.

Also, St. Louis Fed President James Bullard said Friday that as the banking sector stress eases, the Federal Reserve will have to raise rates higher.

Bullard remained hawkish "in reaction to the stronger economic news and also on the assumption that the financial stress abates in the weeks and months ahead."

He raised his terminal rate estimate to a 5.50%-5.75% range, while his colleagues maintained their target primarily between 5.00% and 5.25%.

But the bond market is signaling that a Fed pivot is coming, RJO Futures senior market strategist Frank Cholly told Kitco News.

"The bond market is telling us we will get a rate cut. That is favorable for gold. We see a correction after a big rally. But that is not enough to change the trend," Cholly said. "It could be as early as June that we see the Fed start to cut."

In the short term, analysts do not rule out a reversal in gold after its quick gains. But the overall trend will remain intact, taking prices above $2,000 an ounce.

"The immediate stretch might be at risk of exhaustion here. But the trade is constructive as long as gold stays above $1,850. Even if we get a mean washout, the downtrend is broken, and I am looking for an uptrend resumption," Forex.com's senior technical strategist Michael Boutros told Kitco News.

The levels to watch on the way up are $2,034, the record-high weekly close, and then $2,075. That would open the door to $2,150, Boutros said, adding that gold spent very little time above $2,000 an ounce in 2020 or 2022.

The banking crisis, combined with the Fed rate hike expectations easing, is creating "true risk-off haven flows," the technical strategist added.

The biggest variable for gold going forward is the contagion risk in the banking sector. And the central question is whether Washington is willing to backstop all depositors. On that front, U.S. Treasury Secretary Janet Yellen and Fed Chair Jerome Powell have been sending mixed signals.

"We are not done with the banking problem. There is a flight of capital from regional banks, and we might see structural failure. How deep it stretches is the problem. There is also the moral hazard of backstopping all depositors. Can't go case-by-case basis," Boutros said. "With regards to gold, it is a constructive move."

Cholly sees gold well supported at $1,950-$1,975 an ounce.

The banking crisis is doing the work for the Fed, and there could be a credit crunch coming, Cholly warned.

"It will get harder for people to borrow money. That is going to slow things down. We will see things slow down without the Fed having to raise rates further. Banks will be tighter and fussier about lending money," he said.


Next week's data

Tuesday: U.S. CB consumer confidence

Wednesday: U.S. pending home sales

Thursday: U.S. jobless claims, GDP Q4

Friday: U.S. PCE price index

By

Anna Golubova

For Kitco News

Time to Buy Gold and Silver

Tim Moseley