
Gold, silver rebound amid downbeat U.S. retail sales report
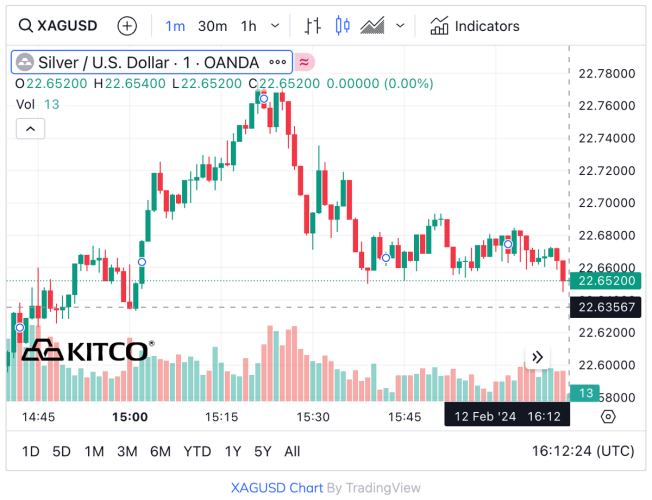
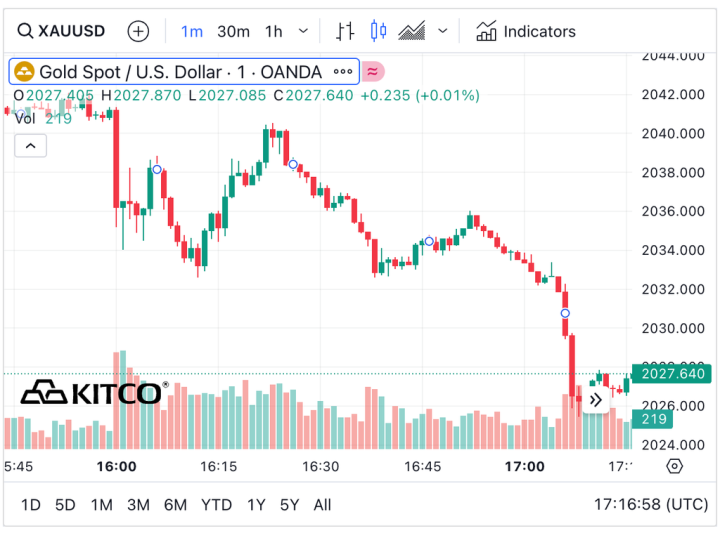
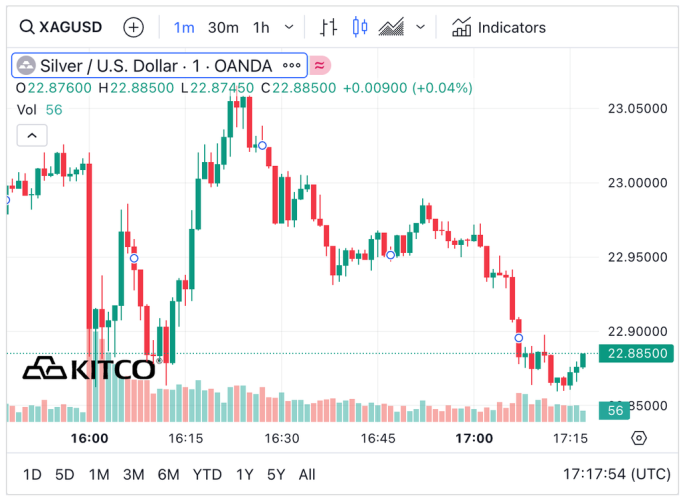
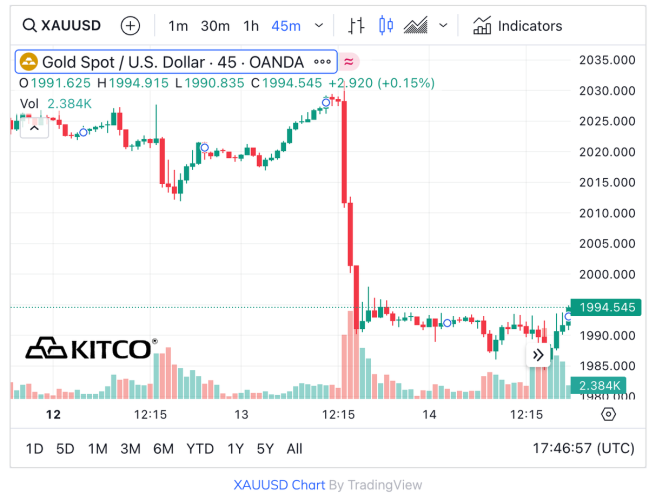
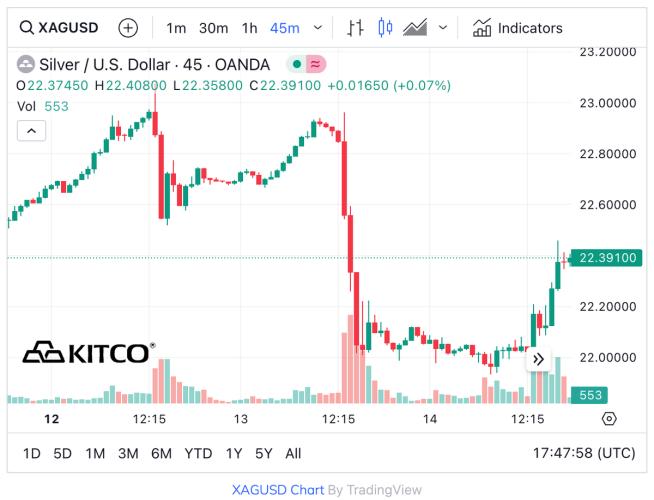
Gold and silver prices are higher in midday U.S. trading Thursday, on corrective rebounds following recent selling pressure and after a U.S. retail sales report that was weaker than expected. April gold was last up $9.60 at $2,013.90. March silver was last up $0.508 at $22.895.
The January U.S. retail sales contracted by 0.8% compared to December, marking the largest decline since March of 2023. This downturn contrasts with a modest 0.4% increase in December and fell short of market expectations, which had anticipated a 0.1% decrease. The decline was widespread across various sectors. However, some sectors saw growth. January typically sees a decline in retail sales following the strong December holiday shopping season. Still, the report falls into the camp of the U.S. monetary policy doves, who want to see the Federal Reserve cut interest rates sooner rather than later.
Asian and European stock markets were mixed to firmer in overnight trading. U.S. stock index futures are mixed near midday.
The next U.S. inflation report comes with Friday’s producer price index report for January, seen coming in at up 0.1% from December, compared to a 0.1% month-on-month decline in the December PPI report. A Wall Street Journal headline today reads: “Pro Take: No big consumer price declines are in sight.”
The key outside markets today see the U.S. dollar index lower after hitting a three-month high Tuesday. Nymex crude oil prices are higher and trading around $78.25 a barrel. Reads a Dow Jones Newswires headline today: Higher global oil supply set to satisfy demand increase, IEA says.”
The yield on the benchmark 10-year U.S. Treasury note is presently fetching around 4.23%.
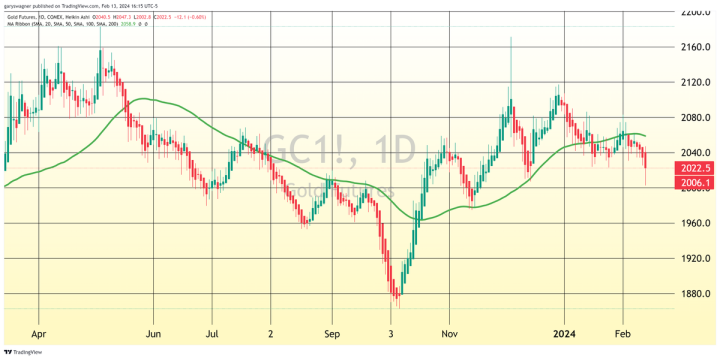
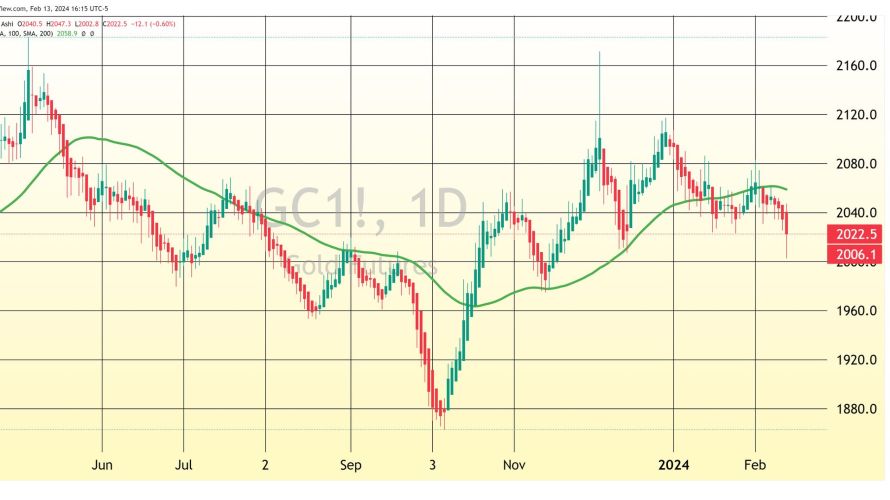
Technically, April gold futures saw short covering featured after prices hit a three-month low Wednesday. The bears have the overall near-term technical advantage. Prices are in a nine-week-old downtrend on the daily bar chart. Bulls’ next upside price objective is to produce a close above solid resistance at the February high of $2,083.20. Bears' next near-term downside price objective is pushing futures prices below solid technical support at the November low of $1,975.10. First resistance is seen at today’s high of $2,020.20 and then at $2,023.30. First support is seen at today’s low of $2,001.80 and then at this week’s low of $1,996.40. Wyckoff's Market Rating: 4.0.
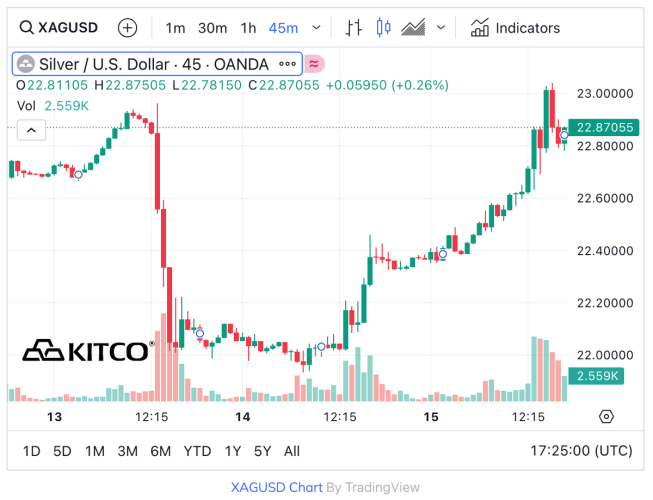
March silver futures also saw short covering after prices hit a four-month low Wednesday. The silver bears have the overall near-term technical advantage. A nine-week-old downtrend is in place on the daily bar chart.
Silver bulls' next upside price objective is closing prices above solid technical resistance at $23.445. The next downside price objective for the bears is closing prices below solid support at the October low of $21.17. First resistance is seen at this week’s high of $23.15 and then at $23.445. Next support is seen at today’s low of $22.40 and then at $22.00. Wyckoff's Market Rating: 3.5.
March N.Y. copper closed up 550 points at 375.50 cents today. Prices closed nearer the session high today. The copper bears have the overall near-term technical advantage. A bearish pennant pattern has formed on the daily bar chart. Copper bulls' next upside price objective is pushing and closing prices above solid technical resistance at 390.00 cents. The next downside price objective for the bears is closing prices below solid technical support at the October low of 355.75 cents. First resistance is seen at 380.00 cents and then at 385.00 cents. First support is seen at today’s low of 370.00 cents and then at last week’s low of 365.50 cents. Wyckoff's Market Rating: 3.5.
Kitco Media
Jim Wyckoff
Tim Moseley

.png)


.png)