

The second week of gains in gold futures confirms a piercing line
Gold futures had a respectable gain this week opening on Monday at approximately $1944, and today closing at approximately $1966. The weekly trading activity resulted in a gain of approximately $22. But most significant is that this week’s price gain follows the prior week's gains. This results in two consecutive weeks of price advances in the precious yellow metal, and the confirmation of a simple bullish reversal pattern based upon Japanese candlesticks.
Japanese candlestick patterns have been used by Japanese market technicians since the 1600’s as a powerful technique to identify pivot or turning points effectively. Several simple two-candlestick patterns can be found on daily, weekly, or even monthly time frames.
Two of the stronger bullish reversal patterns are known as an engulfing bullish and piercing line. The criteria for these patterns begin with the same three rules:
Rule One – The pattern must occur after a defined price correction.
Rule Two – The first candlestick in the pattern must be a large red candle (which is created when the closing price of the time sequence is below the opening price), which trades at a lower low than the previous candle.
Rule Three – The second candlestick in the pattern must open below the prior large red candle.
However, this is where the two candlestick pattern types differ based on where the candle closes. To create an engulfing bullish the large green candle must close above the real body of the prior red candle. In the case of a piercing line although it opens in the same manner as the engulfing bullish it must close at the midpoint or higher.
Both patterns require a confirming candle on the following cycle which is a green candle with a higher high and a higher low.
On a weekly chart of gold futures, we can identify a piercing line that was confirmed this week.
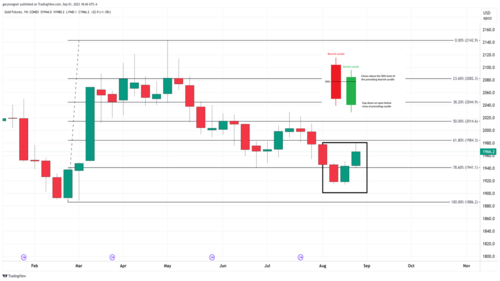
The chart above is a weekly candlestick chart of gold futures. A rectangular box highlighted the last three weekly candlesticks of which candles one and two create the piercing line and candle three identifies the confirming candle. Based on the pattern we conclude that gold could challenge $2000 per ounce based on the highs during the week of July 17 and July 24. During those two weeks, gold traded to a high of $2028 and $2020. Therefore, it is not unreasonable to assume that gold could trade to and move above $2000 or higher during this calendar month.
By
Gary Wagner
Contributing to kitco.com
Tim Moseley