Gold holds above a key support level in light of rising interest and yields
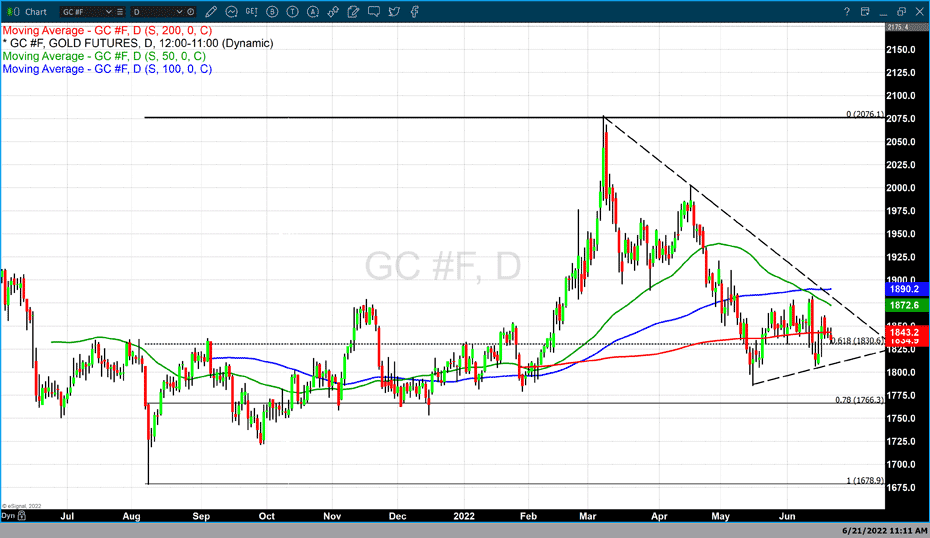
Gold continues to trade in an extremely narrow range as the precious yellow metal reacts to two opposing forces; rising interest rates and inflation. However, the recent price declines in gold have been shallow and short-lived at best. Most importantly, gold prices have held above a key support level which is Fibonacci based. The data set used for this Fibonacci retracement set contains a long period of data. It begins at $1678 which is the low created in August 2021, up to this year’s highest value of $2077. This data set covers a price range of approximately $400.
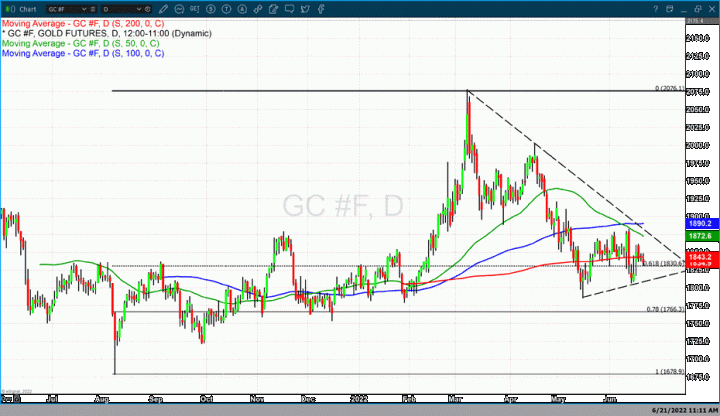
Chart number one is a daily chart of the continuous contract of gold futures. It currently is representing the most active August 2022 contract. After hitting this year’s high in March what followed was a deep correction moving gold from $2077 to $1785. Gold dropped a total of $292 or 15.12% in approximately 2 ½ months. This correction was directly attributable to market participants' focusing on dollar strength the result of rising interest rates and yields.

What followed after gold hit $1785 was an initial rally up to $1881 finding resistance at the 50-day moving average and then correcting to approximately $1807 before forming a base and regaining some value.
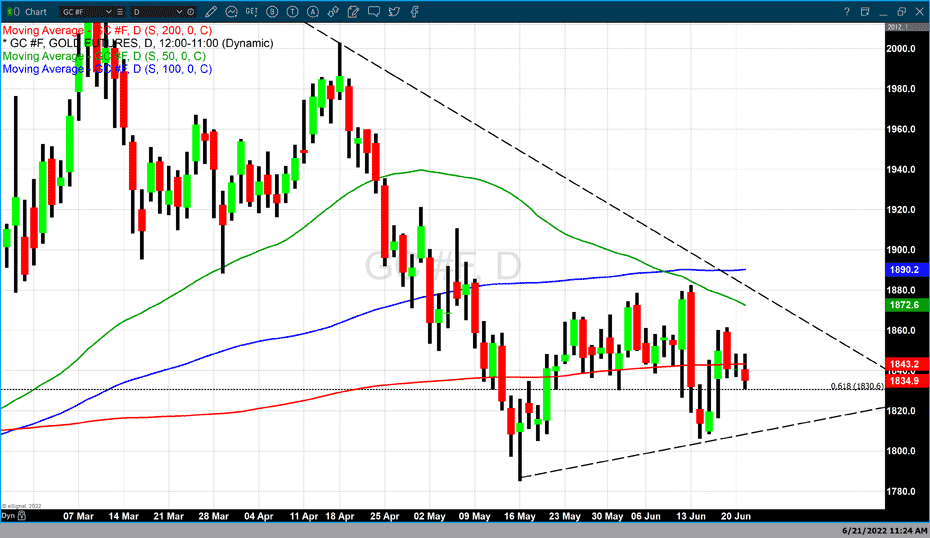
Chart number two is a daily candlestick chart of gold which has been enlarged to detail the most recent price activity. Today gold traded to a low of $1830.70 which is $0.10 above the 61.8% Fibonacci retracement. It is widely recognized amongst technical traders that a deep acceptable correction will typically go to the 61.8% Fibonacci retracement and begin to move higher reigniting the rally which occurred before the correction.
If gold can hold above the key support level of $1830 it will find minor resistance at the 200-day moving average which is currently fixed at $1843.20. Above the 200-day moving average, the next resistance level gold could encounter if it continues to rise from this price point is approximately $1860 which is the high achieved on both Thursday and Friday of last week. Major resistance is currently fixed at $1872.60 which is based upon the shortest term 50-day moving average.

If gold futures can hold $1830 it will either form a foundation at this price point and consolidate, or start a new rally from this base. With the next FOMC meeting scheduled for the end of July, market participants will prioritize their focus on inflation. If inflation continues to run hot, we can expect to see gold move to higher pricing. However, if inflationary pressures begin to abate, we could expect to see gold continues to be pressured resulting in lower prices. I believe that inflation will continue to run hot and continue to be not only persistent but elevated.
By Gary Wagner
Contributing to kitco.com
Time to buy Gold and Silver on the dips
Tim Moseley
