

The gold/silver ratio moves back into familiar territory
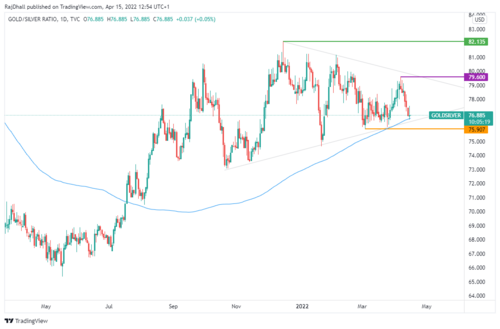
The gold/silver ratio has moved back into familiar territory. The price has moved back into a wedge-type formation on the daily chart below. The trendlines have acted as clear support and resistance levels with both being tested and respected around three times each. More recently the price has moved to the lower bound of the pattern and bounced back up. In terms of support levels, the yellow line at 75.90 is the one to watch but if that breaks 74.64 could be next.
The upside looks more interesting, 79.00 is the previous wave high but the main high on the chart is at the green line (82.13). There is a massive consolidation area at 77.85 and this is where the price seems to gravitate towards. If there is to be another move higher it looks like it could be a magnet for the price once more.
Lastly, the price has also bounced off the 200-day simple moving average (SMA). On this chart, there has not been too much significance on this moving average but historically it has been a good indicator of trend. There was a period between 2017 and 2019 where the 200 SMA worked a treat.
By Rajan Dhall
For Kitco News
Time to buy Gold and Silver on the dips
Tim Moseley