Tag Archives: kinesis money service

Gold silver down even as USDX bond yields see corrective pullbacks

Gold, silver down even as USDX, bond yields see corrective pullbacks

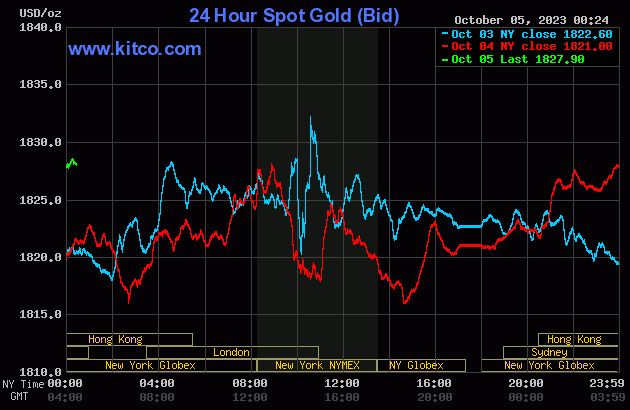
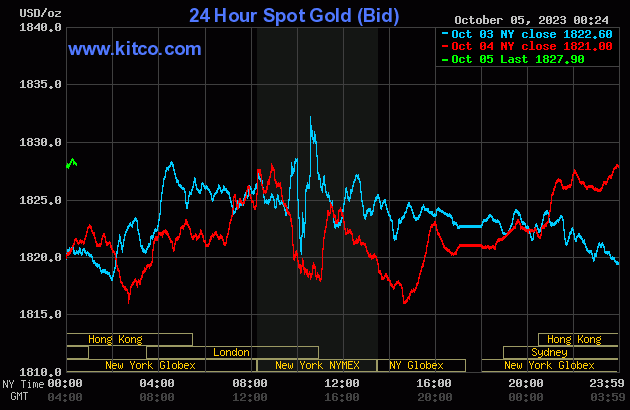
Gold and silver prices are modestly lower in midday U.S. trading Wednesday and not far above this week's multi-month lows. Technical selling is featured amid fully bearish near-term charts. Downside corrections in the U.S. dollar index and in U.S. Treasury yields today did not help out the precious metals bulls. December gold was last down $3.00 at $1,838.30 and December silver was down $0.242 at $21.14.

Today's big downside miss for the ADP National Employment Report—at up 89,000 jobs versus the consensus forecast of up 160,000—gave the bond market bulls some hope Friday morning's more important U.S. jobs report shows a cooling U.S. economy. Traders are indeed starting to look ahead to Friday's September employment situation report from the Labor Department. The key non-farm payrolls number is expected to come in at up 170,000 compared to a rise of 187,000 in the September report.

Risk appetite is not keen at mid-week, following the ouster of the U.S. Speaker of the House of Representatives Tuesday afternoon. The AP said "it was a stunning moment for Speaker Kevin McCarthy, a punishment fueled by growing grievances but sparked by his decision to work with Democrats to keep the federal government open rather than risk a shutdown. Removing the speaker launches House Republicans into chaos heading into a busy fall when Congress will need to fund the U.S. government again or risk a mid-November shutdown."

And then there's the U.S. Treasury sell off that has the marketplace spooked. A Barron's headline today reads: "The bond and stock sell off has momentum. Here's how it could end." The story goes on to say "markets have decided to pay attention to the prospect of the Federal Reserve keeping interest rates higher for longer. And now that's all they can see." The story said the ways the bond market rout can end would be if the Fed stops or reduces its bond selling. Or, "something breaks." The article added weakening U.S. economic data may be needed to help turn the tide of the higher rates narrative. "Friday's September jobs report could be the place for that to begin."

  Nervous crypto investors gain comfort via total return approach instead of only chasing price gains

Asian and European stocks were mixed overnight. U.S. stock indexes are higher at midday on corrective bounces after hitting four-month lows earlier this week.

The key outside markets today see the U.S. dollar index weaker on a corrective pullback after hitting a 10-month high Tuesday. Nymex crude oil prices are sharply lower and trading around $85.25 a barrel. Meantime, the benchmark U.S. Treasury 10-year note yield is presently fetching 4.868% and has hit a 16-year high this week.
Technically, December gold futures prices were poised to close at a 10-month low close today. Bears have the solid overall near-term technical advantage. An accelerating five-month-old downtrend is in place on the daily bar chart. However, the market is well short-term oversold and due for a decent corrective bounce very soon. Bulls' next upside price objective is to produce a close above solid resistance at $1,900.00. Bears' next near-term downside price objective is pushing futures prices below solid technical support at $1,800.00. First resistance is seen at $1,850.00 and then at this week's high of $1,864.70. First support is seen at this week's low of $1,830.90 and then at $1,825.00. Wyckoff's Market Rating: 1.0.
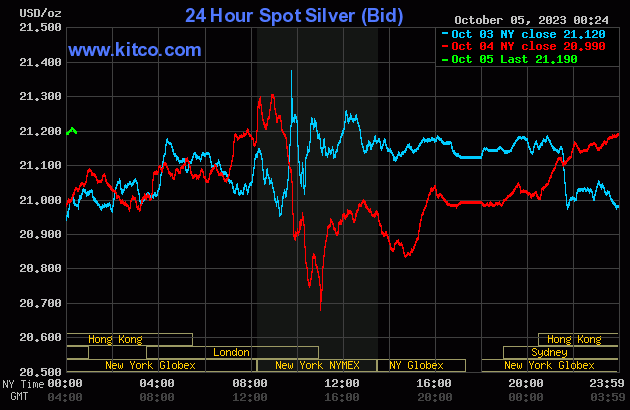
December silver futures prices hit another 6.5-month low today. The silver bears have the solid overall near-term technical advantage. A nine-week-old downtrend is in place on the daily bar chart. However, the market is short-term oversold and due for a corrective bounce very soon. Silver bulls' next upside price objective is closing prices above solid technical resistance at $23.00. The next downside price objective for the bears is closing prices below solid support at the March low of $20.615. First resistance is seen at today's high of $21.57 and then at $22.00. Next support is seen at today's low of $20.85 and then at $20.50. Wyckoff's Market Rating: 2.0.

December N.Y. copper closed down 350 points at 358.60 cents today. Prices closed near mid-range and hit another 10-month low today. The copper bears have the solid overall near-term technical advantage. Prices are in a choppy, two-month-old downtrend on the daily bar chart. Copper bulls' next upside price objective is pushing and closing prices above solid technical resistance at last week's high of 378.60 cents. The next downside price objective for the bears is closing prices below solid technical support at 350.00 cents. First resistance is seen at Tuesday's high of 364.80 cents and then at 370.00 cents. First support is seen at today's low of 354.90 cents and then at 350.00 cents. Wyckoff's Market Rating: 2.0.

By

Jim Wyckoff

For Kitco News

Contact jwyckoff@kitco.com

www.kitco.com

Time to Buy Gold and Silver

Tim Moseley

Friday’s inflation report has investors bracing for volatility

Friday’s inflation report has investors bracing for volatility

Today at 8:30 EDT, the BLS (Bureau of Labor Statistics) will release the latest inflation report vis-à-vis the PCE index for September 2022. This will be the most recent data that the Federal Reserve will have on inflation and therefore be a key component to their sealing the fate of the size of the next rate hike at next week’s FOMC meeting.

According to the CME’s FedWatch tool, there is an 88 % probability that the Federal Reserve will raise rates by 75 basis points, this is a decline from yesterday’s 92.5% probability prediction. This would take the Feds benchmark rate to between 375 and 400 basis points at next week’s Federal Open Market Committee meeting.

According to Bloomberg News economists surveyed are predicting that the PCE Index is forecast to show a 6.3% rise in September from a year ago.

“Excluding food and energy, the gauge is expected to have climbed 0.5% from August and 5.2% from September 2021. The elevated projections follow government figures from earlier this month showing a key measure of core consumer prices accelerated in September to a 40-year high.”

In an article penned by Jessica Menton of Bloomberg News, the most pivotal question facing investors and traders is “whether decades-high inflation is nearing a peak or if prices are going to keep rising … Traders are closely watching the Federal Reserve’s preferred measure of inflation — the personal-consumption expenditures price index — because it will help determine if the central bank moves ahead with another 75 basis-point interest-rate increase at its meeting next week.” Although her article was focused on Wall Street and stock investors her statements offer articulate insight into other asset classes including gold and silver.

Thomas Martin, senior portfolio manager at Globalt Investments said, “The Fed is laying the groundwork to stop having outsized rate increases if the inflation data supports that. But if it doesn’t, they’ll be ready to continue with big hikes beyond November.”

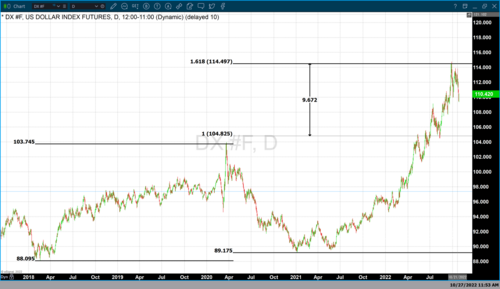
As of 5:20 PM EDT gold futures basis, the most active December contract is fixed at $1667.40 after factoring in today’s net decline of $1.80. However, unlike previous trading days, today's dollar strength had a negative correlation with gold prices. The dollar rose by 0.79% with the dollar index currently fixed at 110.42. This means that the fractional decline in gold would’ve been much larger had the dollar not gained approximately 8/10 of a percent of value.

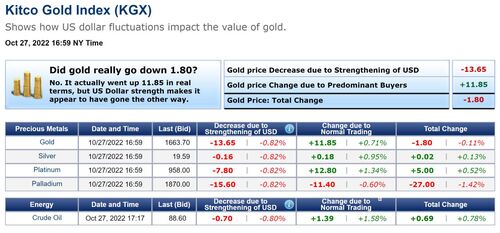
Spot gold is currently fixed at $1663.70 which is also a net decline of $1.80 today. On closer inspection, the Kitco gold index (KGX) reveals that normal trading increased the cost of gold by $11.85, and dollar strength took away $13.65 resulting in today’s fractional price decline.


Market participants are also factoring in how the Federal Reserve will factor in today’s government report that showed that third-quarter GDP rose 2.6% versus the estimate of 2.3%, growing faster than expected. The report revealed that the U.S. economy had its first period of positive growth this year. This caused gold prices to decline after the release of today’s Q3 GDP report. Gold futures traded to a high of $1674.80 today.

Included in today’s Q3 GDP report was the most current data on the annualized federal interest payments indicating that it has increased to $736.5 billion. This set a new record for annual interest payments on our national debt.

According to the US Debt Clock.org, our national debt is currently above $31 trillion and unsustainable. Higher levels of interest set by the Federal Reserve only exacerbate that problem. However, the current level of national debt and the high cost of servicing just the interest creates extremely bullish market sentiment for gold.

By Gary Wagner

Contributing to kitco.com

Time to buy Gold and Silver on the dips

Tim Moseley

Gold holds above key support and the tug-of-war continues

Gold holds above key support, and the tug-of-war continues

Whether you describe the underlying cause of recent changes in financial assets as a tug-of-war, double-edged sword, or battle of opposing forces, inflation versus rising rates continues to cause market sentiment to oscillate. Depending on if inflation or rates are the primary focal points of market participants. That sentiment results in bullish or bearish currents for gold and the dollar as safe-haven assets.

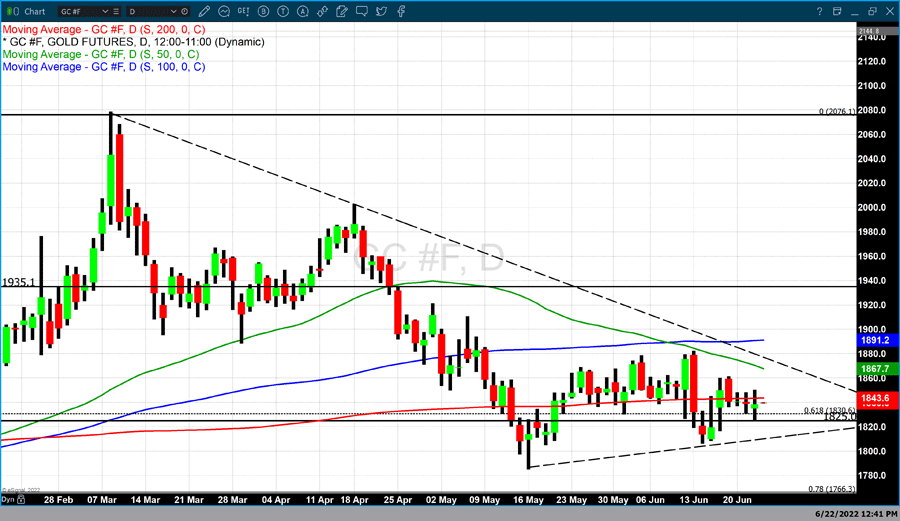
Today, gold traded to a high of $1850.30 a low of $1824.50 and as of 5:55 PM, EDT had a fractional uptick. Gold futures had a trading range of approximately $25 but only managed to gain $0.90 on the day. August gold futures are currently fixed at $1839.70. This could be cited as a true example of opposing forces yielding no victory for either faction. With the FOMC meeting out of the way for this month, traders are awaiting the most recent inflationary data.

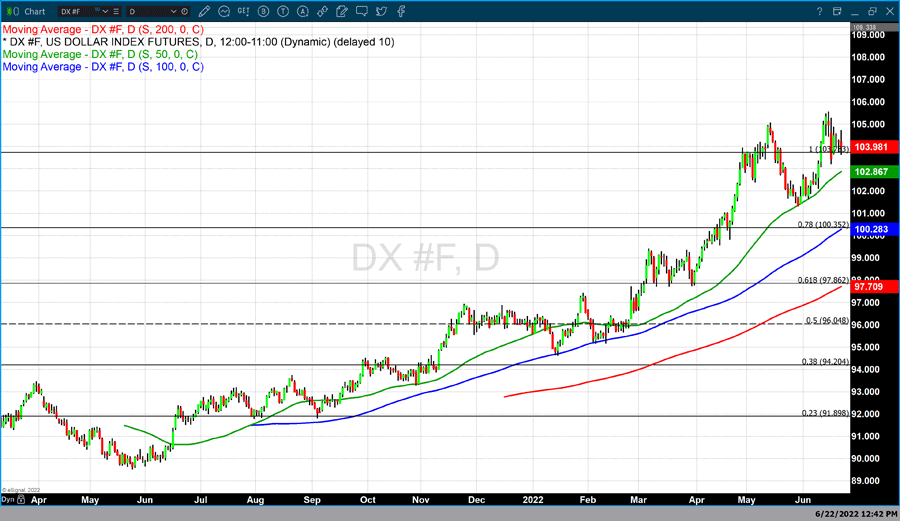
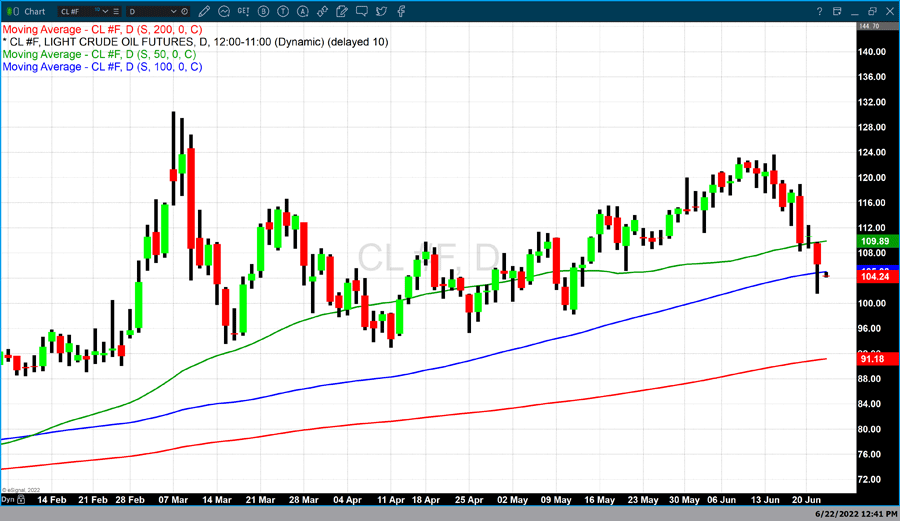
Today’s fractional gains in gold prices are occurring in conjunction with dollar weakness which provided tailwinds for pricing. The dollar index lost 0.2% today and is currently fixed at 104.00. Crude oil recently has traded as high as $123 per barrel. However, oil prices have softened and are currently fixed at $104.19. While crude oil prices are certainly still elevated and above $100 per barrel, oil has retreated over 15% in the last two weeks.

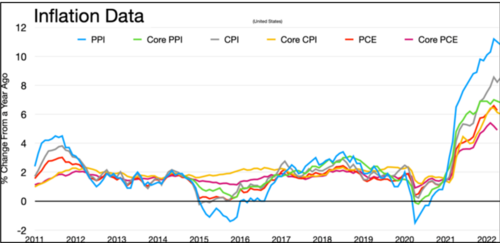
On Thursday, June 30 the government will release the Personal Consumption Expenditures Price Index (PCE) for May. The CPI (Consumer Price Index) showed no indication that inflationary pressures were abating, in fact, it showed just the opposite with the inflation index running at its highest level since the pandemic at 8.6%. The most recent report for the Personal Consumption Expenditures Price Index was 6.3% in April, 6.6% in March, and 6.3% in February.

Chairman Powell refers to this index as a measurement of news headlines because it includes costs of both food and energy which is stripped out of the PCE which is a measure of core inflation. Because the tools of the Federal Reserve cannot address changes in energy and food costs the Federal Reserve prefers the PCE to the CPI.

The PCE inflation report will be a key component aiding Federal members at the July FOMC meeting as they determine potential changes in their tightening monetary policy. During the press conference of the FOMC meeting this month Powell said that it is highly likely that the Fed will raise rates by three quarters of a percent or 75 basis points once again in July.

With the latest economic outlook from the Federal Reserve indicates an economic contraction and reduced GDP coupled with a higher unemployment rate certainly opens the door for the possibility of stagflation. Next week’s PCE report will a major part of the data-dependent decisions made by the Federal Reserve.


By Gary Wagner

Contributing to kitco.com

Time to buy Gold and Silver on the dips


Tim Moseley