
$50,000 gold is likely once the monetary system returns to a gold standard – John Butler
s the world transitions to a gold standard monetary system, the price of gold will skyrocket to $50,000 per ounce, said John Butler, Head of Treasury at TallyMoney and author of The Golden Revolution, Revisited.
“Today, the gold price is too low to allow markets to clear, because assets are over-valued vis-à-vis gold,” he said. “According to my calculations, you’re talking about something in the region of $50,000 per ounce being [reasonable] if you go back to a gold-backed international monetary system.”
Butler claimed that the process of transitioning to a gold standard is inevitable as the U.S. loses its economic dominance and the world become multipolar.
“Gold solves for the game-theoretic monetary equilibrium for a multipolar world that is, nevertheless, hugely dependent on international trade,” he explained. “At the end of the Second World War, the U.S. economy was roughly half the entire global economy. By activity today, it’s only 20 percent… If you just extrapolate this trend, ultimately, it’s going to tip the balance regardless of whether the U.S. retains military superiority or not.”
Butler spoke with David Lin, Anchor and Producer at Kitco News.
Fed policy and gold
On August 26th, Federal Reserve Chairman Jerome Powell gave a hawkish speech at the Jackson Hole Symposium, stating that it would require “pain” to bring inflation down to 2 percent.
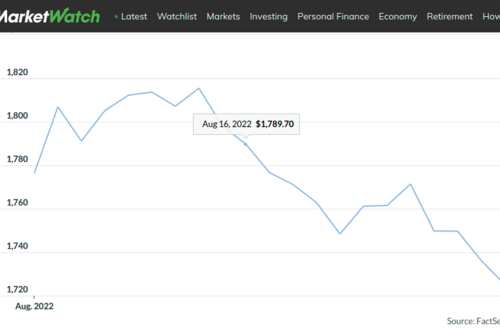
The latest data show that U.S. inflation was 8.5 percent in July.
Opinion is divided on whether the Fed will pivot on its tightening cycle. Butler said that Powell would reverse rate hikes, which could benefit gold.
“[The Fed’s hawkish moment] is taking place right now,” said Butler. “When it goes, and markets reassess in a substantial way that central banks are far more powerless to act on inflation than they thought, I think gold is going to recover all of its losses this year, and indeed reach new highs.”
He added that Powell’s hawkish Jackson Hole speech was merely a “credibility restoration exercise,” and that “The U.S. economy is unable to last with strength if interest rates continue to rise,” which would cause “The Fed to blink sooner than most people believe.”
BRICS: a new reserve currency?
The BRICS nations (Brazil, Russia, India, China, and South Africa) are allegedly developing a new reserve currency, based on a basket of BRICs currencies, to rival the U.S. dollar.
Butler said that although the claim of a new reserve currency “has been a rhetorical talking point for an awfully long time,” that “a heightened degree of geopolitical tensions around the world” could mean more progress towards the BRICS’ goal.
“If [the BRICS] decide to somehow come up with a way to trade bilaterally, and to use each others’ currencies as reserves, or to create a basket of their own currencies and use that as reserves… that would be a world historical event,” he said.
In his book, Butler wrote that the BRICS countries would likely choose “a gold-backed currency of some sort” as “an objective reference currency that can be trusted and accepted by all.”
“The fact is that nobody can print gold, and nobody can create gold,” said Butler. “It’s nice to know that Mother Nature determines how much gold is available… [Gold] facilitates all the good things about international trade while mitigating the potential bad things about monetary manipulation.”
To find out Butler’s thoughts on Bitcoin, watch the video above
By Cornelius Christian
For Kitco News
Time to buy Gold and Silver on the dips
Tim Moseley


.gif)

.gif)

.gif)

.gif)
.gif)