Tag Archives: kinesismoneysystem

Gold gains on short covering bargain buying pullback in USDX

Gold gains on short covering, bargain buying, pullback in USDX

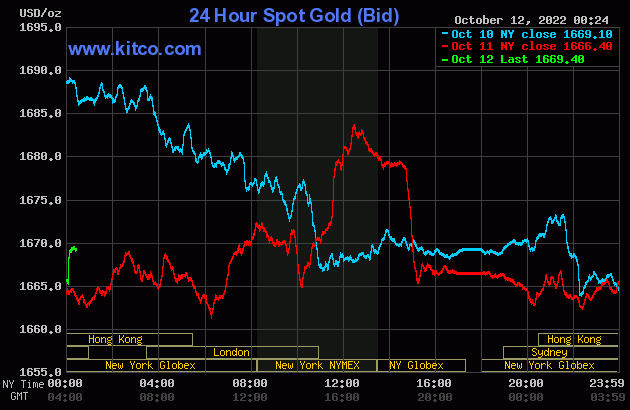
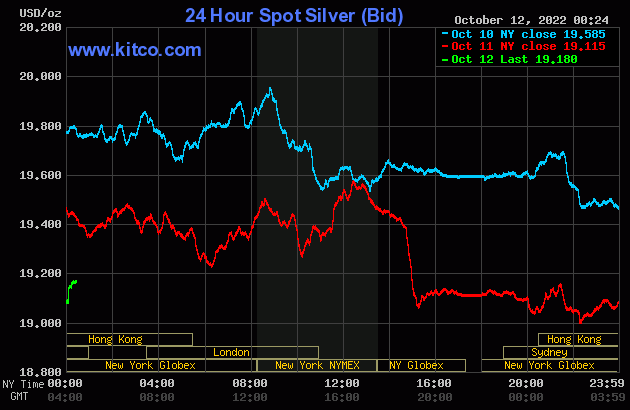
Gold prices are higher in midday U.S. trading Tuesday, on short covering in the futures market and some bargain hunting and/or safe-haven demand in the cash market. A weaker U.S. dollar index and pullback in U.S. Treasury yields on this day is also working in favor of the metals market bulls.

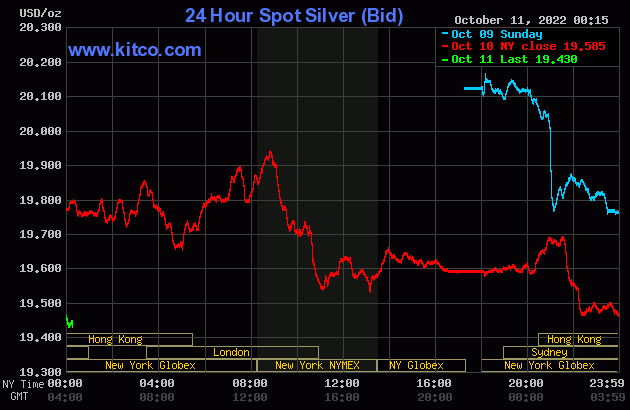
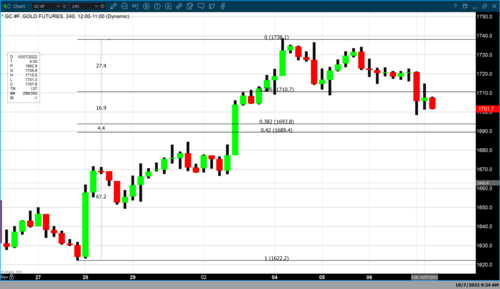
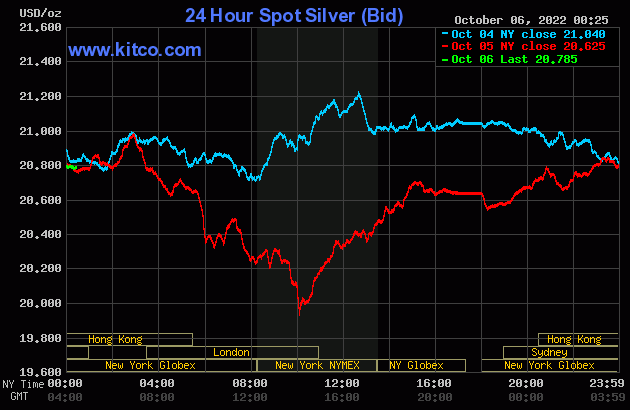
December gold was last up $9.70 at $1,684.70 and December silver was down $0.10 at $19.52.

U.S. stock indexes are mixed at midday. Dour comments Monday on the global economic/political outlook from the respected chief of JP Morgan, Jamie Dimon, as well as an escalation in the Russia-Ukraine war, are keeping a “risk-off” trader and investor mentality in the general marketplace.

The U.K. government bond market is still roiled, as the Bank of England was forced to stepped in to buy inflation-linked bonds to its bond-buying program. There are worries U.K. pension funds could be lost in any more serious U.K. bond market rout.

The key outside markets today see the U.S. dollar index weaker on a corrective pullback from recent strong gains. Nymex crude oil prices are lower and trading around $89.25 a barrel. The U.S. Treasury 10-year note yield is presently fetching around 3.9%.

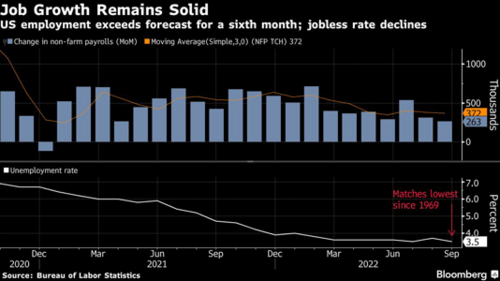
Traders are looking ahead to key U.S. inflation reports on Wednesday and Thursday mornings. The producer price index report for September is out Wednesday and the consumer price index report for September is out Thursday. The consumer price index is expected to come in at up 8.1%, year-on-year, following a rise of 8.3% in August.

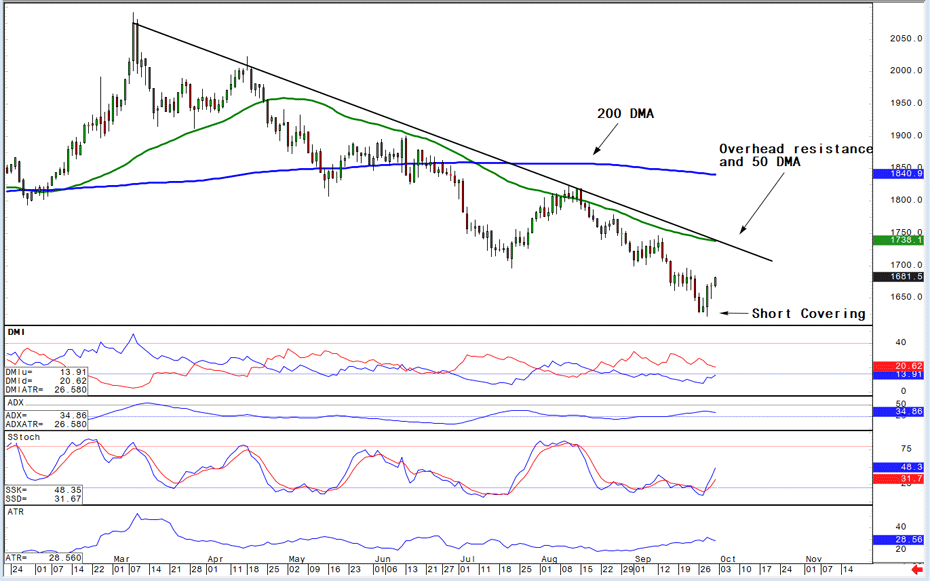
Technically, the gold futures bears still have the solid overall near-term technical advantage. Bulls’ next upside price objective is to produce a close above solid resistance at the October high of $1,738.70. Bears' next near-term downside price objective is pushing futures prices below solid technical support at the September low of $1,622.20. First resistance is seen at $1,700.00 and then at this week’s high of $1,707.40. First support is seen at today’s low of $1,667.50 and then at $1,650.00. Wyckoff's Market Rating: 2.5.

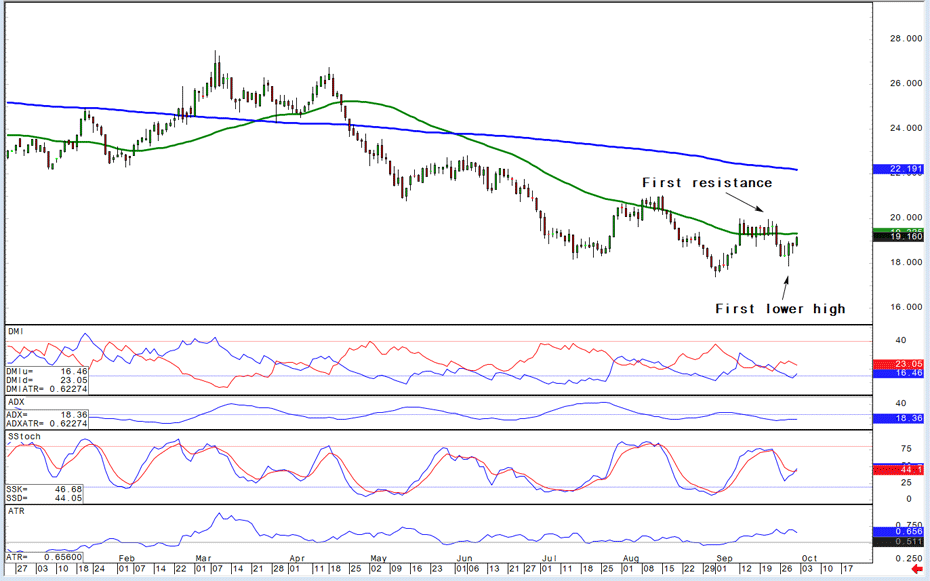
The silver bears have the overall near-term technical advantage. Silver bulls' next upside price objective is closing prices above solid technical resistance at the October high of $21.31. The next downside price objective for the bears is closing prices below solid support at $18.00. First resistance is seen at $20.00 and then at this week’s high of $20.21. Next support is seen at today’s low of $19.225 and then at $19.00. Wyckoff's Market Rating: 3.5.

December N.Y. copper closed up 215 points at 345.20 cents today. Prices closed nearer the session high today. The copper bears have the overall near-term technical advantage. Copper bulls' next upside price objective is pushing and closing prices above solid technical resistance at the September high of 369.25 cents. The next downside price objective for the bears is closing prices below solid technical support at the July low of 315.55 cents. First resistance is seen at 350.00 cents and then at the September high of 359.30 cents. First support is seen at last week’s low of 335.20 cents and then at the September low of 324.30 cents. Wyckoff's Market Rating: 3.0.

By Jim Wyckoff

For Kitco News

Time to buy Gold and Silver on the dips

Tim Moseley

Strong USDX rising US Treasury yields stingy Fed punish gold silver prices

Strong USDX, rising U.S. Treasury yields, stingy Fed punish gold, silver prices

Gold and silver prices are sharply lower near midday Monday. The safe-haven metals are being hit hard by a higher U.S. dollar index, rising U.S. Treasury yields and weaker crude oil prices to start the trading week. An aggressively tight monetary policy from the U.S. Federal Reserve is also serving as an anchor on the precious metals markets. December gold was last down $34.30 at $1,675.00 and December silver was down $0.61 at $19.645.

Global stock markets were mostly lower overnight. U.S. stock indexes are weaker at midday. U.S. government offices and many banks are closed Monday for the Columbus Day national holiday. Stock market traders will focus on a barrage of corporate earnings reports out this week.

Risk aversion is still elevated. The Russia-Ukraine war has escalated as Russia launched missiles into several Ukrainian cities after a strategic bridge for Russia in the Crimea region suffered major damage from explosions, with Ukraine’s military likely the culprit. Meantime, North Korea has test-fired ballistic missiles to provoke the West in an already-tense global geopolitical environment.

The short-squeeze won't last, silver price to end the year lower warns Metals Focus

The key outside markets today see the U.S. dollar index solidly higher. Nymex crude oil prices are weaker and trading around $92.00 a barrel. The U.S. Treasury 10-year not yield is presently fetching 3.9%.

Traders are looking ahead to key U.S. inflation reports on Wednesday and Thursday. The producer price index for September is out Wednesday morning. The consumer price index report for September is out Thursday, which is expected to come in at up 8.1%, year-on-year, following a rise of 8.3% in August.

Technically, the gold futures bears have the solid overall near-term technical advantage and gained fresh power on momentum today. Bulls’ next upside price objective is to produce a close above solid resistance at the October high of $1,738.70. Bears' next near-term downside price objective is pushing futures prices below solid technical support at the September low of $1,622.20. First resistance is seen at $1,700.00 and then at today’s high of $1,707.40. First support is seen at $1,662.00 and then at $1,650.00. Wyckoff's Market Rating: 2.0

The silver bears have the slight overall near-term technical advantage. Silver bulls' next upside price objective is closing prices above solid technical resistance at the October high of $21.31. The next downside price objective for the bears is closing prices below solid support at $18.00. First resistance is seen at $20.00 and then at today’s high of $20.21. Next support is seen at $19.25 and then at $19.00. Wyckoff's Market Rating: 4.5.

December N.Y. copper closed up 560 points at 344.35 cents today. Prices closed nearer the session high today. The copper bears have the overall near-term technical advantage. Copper bulls' next upside price objective is pushing and closing prices above solid technical resistance at the September high of 369.25 cents. The next downside price objective for the bears is closing prices below solid technical support at the July low of 315.55 cents. First resistance is seen at 350.00 cents and then at the September high of 359.30 cents. First support is seen at last week’s low of 335.20 cents and then at the September low of 324.30 cents. Wyckoff's Market Rating: 3.0.

By Jim Wyckoff

For Kitco News

Time to buy Gold and Silver on the dips

Tim Moseley

Gold and silver need more than a short squeeze

Gold and silver need more than a short squeeze

Precious metal analysts have been warning investors for a few weeks now that a sharp downtrend through the summer pushed gold and silver into oversold territory. Bearish sentiment in the marketplace is at its highest level in years, and both precious metals were ripe for a short squeeze.

Those forecasts proved to be correct, with silver seeing, at its peak, a 12% gain this week, as prices pushed above $21 an ounce. Meanwhile, the gold market saw a 4% rally as prices drove above $1,730 an ounce.

However, heading into the weekend, momentum is starting to wane as gold ends the week testing support at $1,700 an ounce and silver tries to hold on to $20. While this past week's rally has been a welcome move for some, analysts note that the market still lacks a critical ingredient: bullish investors.

Ultimately, the gold and silver market lacks solid bullish conviction to see a sustained rally for now. Many investors continue to sit on the sidelines as the Federal Reserve and the U.S. dollar dominate financial markets.

Despite the growing threat of a severe global recession, the Federal Reserve continues to aggressively raise interest rates, which is supporting the U.S. dollar at its highest level in 20 years. At the same time, bond yields are near 12-year highs. This is not a positive environment for gold.

These headwinds for gold are not expected to ease anytime soon. Even some market heavyweights are starting to embrace the idea of a strong U.S. dollar. Ray Dalio made headlines this week, announcing on Twitter that he no longer thinks cash is trash, a position he has held for a few years.

"The facts have changed and I've changed my mind about cash as an asset: I no longer think cash is trash," wrote Dalio. The following day Dalio announced that he would step down as Bridgewater's co-CIO

Last month, Dalio said that he expects the Federal Reserve to push interest rates to 4.5%, which will cause the S&P 500 to fall another 20%. In the current environment, the U.S. dollar is seen as the safest asset right now.

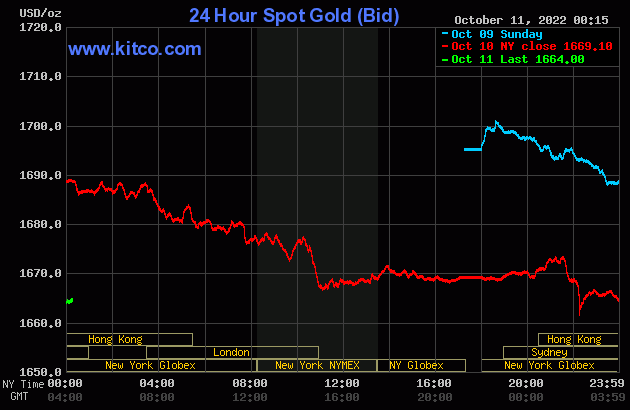
There is a growing divergence between physical gold and the paper market – WisdomTree

The reality is that gold continues to face a difficult environment and the volatility we have seen this week can frustrate many investors; however, one recurring message we keep hearing from market analysts is that investors need to look past this volatility and keep their eye on the larger picture.

The Federal Reserve is maintaining its aggressive monetary policy action in a vacuum. They are focusing on the domestic labor market and ignoring the impact that the U.S. dollar is having on the global economy.

While the U.S. economy has remained relatively resilient, the global marketplace is at a breaking point. Monday, the United Nations even stepped into the debate and warned that central bank rate hikes will push the global economy, particularly emerging nations, into a recession.

In its latest economic projections, the United Nations Conference on Trade and Development lowered its economic growth forecasts seeing global GDP expanding 2.5% this year, down from its previous estimate of 2.6%. At the same time, global growth is expected to slow to 2.2% in 2023.

The advice I am hearing from market analysts is that even as this short squeeze fails, the current price still represents long-term value.

By Neils Christensen

For Kitco News

Time to buy Gold and Silver on the dips

Tim Moseley

How to interpret today’s jobs report and what does it mean fo price ofgold ?

 How to interpret today’s jobs report, and what does it mean fo price of gold ?

Today’s jobs report for September showed a decrease in monthly gains, with 263,000 new jobs added last month, a decline from the prior month in which 315,000 new jobs were added.

The deep impact it had on almost every asset class in the financial markets was not because of the tepid numbers but rather hopes by the Federal Reserve that these numbers would be even lower. The Federal Reserve had hoped that today’s report would reveal even slower growth because that would indicate progress by the Federal Reserve in reducing inflation.

Inflation is still greatly elevated at a 40-year high even after the Federal Reserve has raised interest rates at every FOMC meeting since March. The Fed raised rates by 25 basis points in March, 50 basis points in May, and 75 basis points in June, July, and September. The Fed took their benchmark Fed funds rate from between 0 and 25 basis points in February to between 300 and 325 basis points in September.

Although today’s report indicated slowing job growth it is believed that this contraction is not enough for Federal Reserve to slow down its current pace of interest-rate hikes.

According to CME’s FedWatch tool, last week there was a 56.5%% probability, yesterday there was a 75.2% probability which today swelled to an 82.3% probability that the Federal Reserve will raise rates by 75 basis points for the fourth consecutive time at the November FOMC meeting. This probability indicator forecast the probability of FOMC rate moves by using the 30-day Fed Funds futures pricing data.

Today’s report had a profound effect on U.S. equities. As of 2:35 PM EDT, the Dow is currently trading off by 661 points a decline of 2.22%. The NASDAQ is currently down 3.75% a decline of approximately 415 points, and the S&P is down 106.16 points or 2.90%.

Today’s report also had a deep impact on gold pricing which opened at $1721 and then traded to a high of $1722.80 before the release of the report which took gold futures basis the most active December contract to today’s low of $1698.40. Gold futures did recover trading to approximately $1714 a few hours after the release of the report. However, as of this writing at 3:20 PM, EDT over the last hour gold has been trading between $1702 and $1706.

So, what does this mean for the future of gold pricing? I believe that although this report is extremely important in an exceedingly important data set that the Federal Reserve will use at their November 2 FOMC meeting, it will be next week’s CPI inflation report for September that will be much more significant. But in terms of the long-term effect of the Federal Reserve on gold pricing, it is highly likely that if the Fed continues to raise rates and inflation remains persistent at some point market participants will have to focus on the high level of inflation rather than being laser-focused on rising rates. If that assumption is correct, it could take gold dramatically higher. But it is also likely that there will be more pain ahead.

Our technical studies indicate that the first level of resistance occurs at $1710 the 23.6% Fibonacci retracement which is based on a very short-term Fibonacci retracement data set from September 28 to October 7. Major resistance occurs at $1738 the recent high of the rally which began after gold hit its lowest value in years at $1621. The first level of support occurs at $1693.80 the 38.2% Fibonacci retracement and then at $1689.40 a 42% retracement.

By Gary Wagner

Contributing to kitco.com

Time to buy Gold and Silver on the dips

Tim Moseley

The short-term future of gold’s price is tied to two upcoming reports

The short-term future of gold’s price is tied to two upcoming reports

There is an adage when investigating a crime that says to “follow the money”. In the same way, when investigating where gold prices will be headed short-term it is wise to follow the upcoming reports. Two key reports will shape the short-term direction and price of gold. The first report is tomorrow’s jobs report, and the second report is the next CPI inflation report for September which will be released on October 13.

The forecast for tomorrow’s jobs report according to FactSet is expected to show an increase of 250,000 jobs being added in September which would be down from the 315,000 new jobs added in the prior month. Bloomberg’s predictions are close, forecasting an additional 260,000 new jobs were added in September. The Wall Street Journal is expecting that Friday’s jobs report will show that an additional 275,000 new jobs were added last month. In other words, expectations for tomorrow’s report are fairly aligned and in agreement.

If these various forecasts are correct, it would represent the slowest month of job growth since December 2020. However, analysts and economists will focus on whether or not the labor market is showing signs of contracting as a positive indication. In other words, in the case of tomorrow’s report, good news would be bad news for U.S. equities and gold. This is because slower growth in terms of jobs being added would help the Federal Reserve loosen its pace of rate hikes in its fight to bring down the 40-year high and inflation.

This week’s ADP private sector jobs report showed that 208,000 additional jobs were added last month. These numbers came in above expectations and forecasts. If tomorrow’s jobs report comes in above estimates it would harden the Federal Reserve’s resolve to continue to raise rates at an extremely rapid pace.

But the most important report that the Federal Reserve will use in their decision process about their monetary policy is next week’s CPI inflation report for September. It will provide clear-cut and undeniable evidence as to whether or not recent action by the Federal Reserve has begun to reduce inflationary pressures. Currently, the CPI inflation index is at 8.3% down 0.2% from the prior month’s 8.5%. However, the most recent data on the preferred inflation index of the Federal Reserve the PCE showed that inflation had a slight uptick from the previous month.

According to the CME’s FedWatch tool, there is a 68.7% probability that the Federal Reserve will raise rates for the fourth consecutive time by 75 basis points. This would take the fed funds rate which is currently at 300 – 325 basis points to 375 – 400 basis points on November 3, the final day of the November FOMC meeting.

For those who would like more information simply use this link.

By Gary Wagner

Contributing to kitco.com

Time to buy Gold and Silver on the dips

Tim Moseley

Gold silver prices pull back as US dollar bond yields see strong rises

Gold, silver prices pull back as U.S. dollar, bond yields see strong rises

Gold and silver prices are lower in midday U.S. trading Wednesday, on routine downside price corrections following solid gains posted on Monday and Tuesday. A strong rebound in the U.S. dollar index today, along with a significant rise in U.S. Treasury yields, are also bearish outside market elements working against the gold and silver markets at mid-week. December gold was last down $11.60 at $1,718.90 and December silver was down $0.649 at $20.455.

Gold prices down-ticked following the early morning release of a slightly stronger-than-expected U.S. ADP jobs report showing a gain of 208,000 in September. That compares to expectations for a rise of 200,000. Arguably the most important U.S. data point of the week, if not the month, is Friday's employment situation report for September from the Labor Department. The key non-farm jobs number is expected to come in at up 275,000. The August report showed a non-farm jobs rise of 315,000.

Global stock markets were mixed overnight, with European shares mostly weaker and Asian shares mostly firmer. U.S. stock indexes are lower at midday, on routine corrective pullbacks after solid gains posted on Monday and Tuesday that were the largest two-day advance in over two years.

Said market analyst Craig Erlam of OANDA: "It's been a very impressive relief rally, albeit one aided by a rose-tinted interpretation of certain economic indicators and a terrible plunge in the weeks before. This isn't the time to get carried away but it is understandable that we're seeing some relief. It all hangs on whether the (recent economic) data is the start of a weakening trend or just a blip, as with the July inflation drop."

With so many gold and silver bears, it doesn't take much to trigger a short squeeze

In overnight news, New Zealand's central bank raised interest rates by 50 basis points, to 3.5%, and hinted of more to come, with policymakers even debating 75 basis points next time, as core inflation remains too high and labor resources are tight.

Today's OPEC+ meeting saw the cartel make a large crude oil output cut of 2 million barrels per day, in response to a weakening global economic outlook. The crude oil market saw no major reaction, as prices had been rallying in recent days on the expected OPEC cut.

The key outside markets today see the U.S. dollar index strongly higher. Nymex crude oil prices are higher and trading around $87.75 a barrel. Meantime, the yield on the 10-year U.S. Treasury note is presently fetching 3.78%.

Technically, December gold futures saw a routine corrective pullback. Prices hit a three-week high Tuesday. The gold futures bears still have the overall near-term technical advantage. However, it appears a near-term market bottom is in place. Bulls' next upside price objective is to produce a close above solid resistance at $1,778.80. Bears' next near-term downside price objective is pushing futures prices below solid technical support at this week's low of $1,666.50. First resistance is seen at this week's high of $1,738.70 and then at the September high of $1,746.40. First support is seen at today's low of $1,708.80 and then at $1,700.00. Wyckoff's Market Rating: 3.0

December silver futures also saw a routine corrective pullback after hitting a three-month high Tuesday. The silver bulls have the slight overall near-term technical advantage. Silver bulls' next upside price objective is closing prices above solid technical resistance at $22.50. The next downside price objective for the bears is closing prices below solid support at $19.00. First resistance is seen at $21.00 and then at this week's high of $21.31. Next support is seen at $20.00 and then at $19.60. Wyckoff's Market Rating: 5.5.

December N.Y. copper closed up 120 points at 350.20 cents today. Prices closed nearer the session high again today and hit a nearly three-week high. The copper bears have the overall near-term technical advantage. Prices are still in a five-week-old downtrend on the daily bar chart. Copper bulls' next upside price objective is pushing and closing prices above solid technical resistance at the September high of 369.25 cents. The next downside price objective for the bears is closing prices below solid technical support at the July low of 315.55 cents. First resistance is seen at today's high of 354.50 cents and then at 360.00 cents. First support is seen at Tuesday's low of 340.20 cents and then at this week's low of 335.20 cents. Wyckoff's Market Rating: 3.0.

By Jim Wyckoff

For Kitco News

Time to buy Gold and Silver on the dips

Tim Moseley

Will this silver and gold price rally last? Here’s what analysts are saying

Will this silver and gold price rally last? Here's what analysts are saying

In a surprise u-turn this week, silver and gold are trading at 3-month and 3-week highs, respectively. But is this a sustainable rally or just a short squeeze?

Even though silver has outperformed gold this week, both precious metals saw impressive performance. Some main drivers were a weaker U.S. dollar, falling U.S. Treasury yields, higher crude oil, and renewed safe-haven buying amid shifting Fed rate hike expectations and disappointing macro data.

"There have been vicious reversals in precious metals, with Gold +5%, Silver +14%, Platinum +9% and Palladium +11% the past five days," said MKS PAMP metals strategist Nicky Shiels. "Gold has essentially erased 1/4 of the downtrend channel worth $460 (from March '22 peak to its September tough), which started from its invasion/war peak price at $2,070/oz; silver has clawed back 2/5th (in 3 days!) of the same downtrend channel."

The United Nations also spoke up this week, urging the Federal Reserve and other central banks to ease up on rate hikes, warning that tighter monetary policies are pushing the global economy into a recession.

"There's still time to step back from the edge of recession," UNCTAD Secretary-General Rebeca Grynspan said. "But the current course of action is hurting the most vulnerable, especially in developing countries and risks tipping the world into a global recession."

Gold climbed around $65 this week, with December Comex gold futures last trading at $1,733.50 an ounce. And silver jumped about $2.25, with December silver futures last at $21.10.

This is an important technical turnaround for gold after six straight months of losses.

"Market speculation around the Fed adopting a less aggressive approach on rate hikes has also sweetened appetite for zero-yielding gold," said FXTM's senior research analyst Lukman Otunuga. "Looking at the technical picture, the breakout above $1,700 may open the doors towards $1,724 and $1,760, respectively. Should prices dip back under $1,700, the next key levels of support can be found at $1,680 and $1,655."

Also helping the precious metals was the reversal of U.K. governments tax plan and fears around Credit Suisse, noted Shiels.

"What is perhaps overlooked is that this massive reversal in risk assets, precious metals & bonds, all started when risk sentiment was max bearish when the BOE intervened to cap rates (last week). There is a growing acceptance that the BOE is not going to be the last central bank to cap rates, and eventually, the U.S. will follow suit," she wrote Tuesday.

However, some analysts are warning the price rally in precious metals is a temporary one – just a short squeeze after a build-up of short positions.

"We see gold losing steam and again drifting toward our target of $1,580/oz over the coming months, as the Fed continues to stick to its hawkish plan to move the Fed Funds above the 4.5% mark," said TD Securities head of commodity strategy Bart Melek. "As such, rates on the short end of the curve will very likely keep rising from current levels and should stay there for the balance of 2023 … Real rates, which are the key drivers of gold, will also rise even faster. This will increase the carry costs and opportunity cost relative to risk-free Treasuries."

The short-term direction will mostly depend on the employment report out of the U.S. this Friday. A higher-than-expected number of jobs added in September would trigger a more hawkish re-pricing of rate hike expectations and would weigh on gold.

"The U.S. domestic story remains rather solid, leaving the Fed tightening prospects alive even if markets have recently revised the expected terminal rate to sub 4.50% levels. We see Friday's payrolls report as a potential trigger for a fresh hawkish re-pricing, and a positive event for the dollar," said ING FX strategists Tuesday.

On the other hand, if the jobs report is weaker-than-expected, rate hike expectations would drop and favor higher precious metals prices.

"It is too early to say a Fed pivot is justified, but if we continue to see a couple sharp drops with job openings, that will wake up the doves in the FOMC," said OANDA senior market analyst Edward Moya. "Gold's bottom is in place now that the U.S. is showing clear signs the labor market is softening. The key for gold will be the nonfarm payroll report. As long as we don't see an extraordinary strong print, gold should remain supported here and poised to test the $1,750 region."

By Anna Golubova

For Kitco News

Time to buy Gold and Silver on the dips

Tim Moseley

Gold prices push to 1675 as US core PCE rises 06 in August

Gold prices push to $1,675 as U.S. core PCE rises 0.6% in August

Hotter-than-expected inflation data is providing some initial support for the gold market as prices retest the long-term support/resistance level at $1,675 an ounce.

Friday, U.S. Department of Commerce said its core Personal Consumption Expenditures price index increased 0.6% last month, up from July’s reading of 0.1%. Economists were expecting to see a 0.5% rise.

According to some economists, the rise in core inflation is an indication that rising consumer prices are becoming entrenched in the economy, which will provide further challenges for the Federal Reserve.

The gold market has seen a modest jump in initial reaction to the latest inflation data. December gold futures last traded at $1,675.70 an ounce, up 0.44% on the day.

The latest economic report also noted that consumers are once again spending more than they are earnings. Personal income in August rose 0.3%, in line with expectations; meanwhile, personal spending rose 0.4%. The data beat expectations as economists were forecasting a 0.2% increase.

According to some economists, consumes are being forced to spending more because of inflation.

Gold hasn’t been much of an inflation hedge through 2022 as higher consumer prices have forced the Federal Reserve to aggressive raise interest rates, which has pushed real yields into positive territory. However, some analysts have said that sentiment in the gold market could slowly be changing as the Fed’s monetary policy could be close to a breaking point

Massive volatility in global currency markets this week as been a signal for many investors that the surging momentum in the U.S. dollar, driven by the rising Fed Funds rate is causing problems for the global economy.

By Neils Christensen

For Kitco News

Time to buy Gold and Silver on the dips

Tim Moseley

Can gold price put an end to its six-month losing streak? Prices are at ‘critical juncture’ – analysts

Can gold price put an end to its six-month losing streak? Prices are at 'critical juncture' – analysts

What gold does in the next two weeks will be critical for prices going into the year-end, according to analysts. All eyes are on the latest rounds of employment and inflation data as gold shows promising signs amid escalating geopolitical tensions and intensifying market volatility.

Gold saw a key development mid-week as prices rose from 2.5-year lows and headed towards the $1,700 an ounce level. At the time of writing, December Comex futures were trading at $1,673.70, up more than 1% on the week but down for the sixth month in a row.

"On Wednesday, gold had a key reversal. We made a new swing from the lows and ended up with a higher close. We had some follow-through Thursday and Friday. Looking at the gold chart, this is very positive. We go from a short-term trend down to sideways and up now," RJO Futures senior market strategist Frank Cholly told Kitco News.

If the gold market can get back above $1,700, the uptrend will be achieved, and a run to $1,740 would be possible, Cholly added.

Before this week, gold technicals were very negative, especially following a drop below $1,680. A steeper decline below $1,600 could have opened the door to a more significant selloff down to $1,290, said DailyFX strategist Michael Boutros.

"The technicals were very gloomy here," Boutros told Kitco News. "If gold prices are able to get above $1,706, we can dispel this downside break."

But the move higher needs to happen within the next two weeks. Otherwise, the downward trend will take over. "What happens in the next two weeks in price is paramount. The extraordinary speed and magnitude of Fed rate hikes put heavy pressure on gold," Boutros noted.
 

Geopolitical tensions could be one short-term driver that gets gold above $1,700. The latest development saw Russia annex four regions in south-eastern Ukraine, promising to use all means necessary to defend the territory.

"If escalation in Russia does start to mount the concern of real possible nuclear threat," that would be positive for gold, added Boutros.

However, it is essential to remember that any geopolitical gains in gold are likely only temporary, said TD Securities global head of commodity strategy Bart Melek. "Any time there is an increase in geopolitical risk, there is at least a temporary upside," he said.

But considering the monetary policy situation, it will be hard to shift gold's overall bearish trend.

"Ultimately, the U.S. dollar continues to be strong. The outlook hasn't changed. The Fed will continue to raise rates. And we'll have the Bank of England doing pretty aggressive tightening as well," Melek pointed out.

UK's market chaos, contagion risk: what it all means for gold price

Employment and inflation data

Gold's near-term direction will largely depend on the employment and inflation data released in the first two weeks of October.

"I don't see a breakout in gold until we see the employment and inflation numbers. If CPI or employment is stronger than expected, that is a negative for gold. It suggests that the Fed would be more likely to continue hiking as per its 4.6% outline in the dot plot. High inflation would also mean that market could price in something more aggressive down the road," Melek described.

Market consensus calls estimate the employment report to show the economy adding 250,000 positions in September and the unemployment rate remaining near 50-year lows at 3.7%.
 

The annual inflation number is expected to come at 8.1% in September after posting 8.3% in August.
 

Next week's data

Monday: U.S. ISM manufacturing PMI

Wednesday: U.S. ADP nonfarm employment, ISM non-manufacturing

Thursday: U.S. jobless claims

Friday: U.S. nonfarm payrolls
 

By Anna Golubova

For Kitco News

Time to buy Gold and Silver on the dips

Tim Moseley

GoldSilver – Use options to play a short covering rally

Gold/Silver – Use options to play a short covering rally

What a volatile week it's been with the month and quarter ending after a downgrade of Apple stock sent retail stock investors scrambling for the exit signs and the British Pound falling to a record low against the Dollar. The U.K. government presented a fiscal spending plan that could put the next round of U.K. inflation through the roof. At the same time, the Bank of England admitted its first policy mistake and is in a state of "panic" that requires the need to deliver 175-200 bps in rate hikes over the next two meetings. Bringing it back to the U.S., Fed Fund futures are pricing in a 50/50 chance of another 50 or 75 bps rate hike at the next Fed meeting. That leaves traders wondering how long before the Fed admits its policy mistake of tightening too far into a recession.

The aggressive tightening of monetary policy in the U.S. has created a strong bid under the U.S. Dollar that will keep pressure on Gold and Silver for the time being. Unfortunately for precious metals bulls, the labor market's strength is the glue that holds the Fed's foot firmly on the rate hike pedal. The only thing that can stop the Fed is both inflation and the labor market showing signs of cooling, which could provide a sharp setback in the Dollar, leaving way for a massive precious metal short-covering rally

How to play these markets?

I cannot reiterate enough that there is a possibility that the Fed will continue to tighten while all of Europe lags in its efforts. However, if the Fed pivots, a short covering rally could unfold. I have found that it is best to use a calculated risk Options strategy in deeply oversold markets that haven't solidified a technical bottom. An options bull call spread is a trading strategy aiming to capitalize on an increase in a given market or asset during times of high volatility or for counter-trend trades. The option strategy consists of two call options that create a range that outlines a lower strike point and an upper strike point. The bullish call spread strategy helps to cap your max loss if the price of an asset drops. However, the strategy also limits the potential gains in case of a price increase. Bullish investors often use this when trading futures as a calculated risk debit spread.

February 2023 Gold Options Trade

We use the February 2023 Gold futures contract in this bull call spread example. We are buying 1 February Gold 1750 call at $45 as our long call. We then simultaneously sell 1 February Gold 1850 call at $22 as our short call. This action creates our premium, which is $23. We then multiply that by $100 to account for Gold's multiplier (a 100-ounce contract) to get $2,300, or our total premium paid (plus any commissions or clearing fees).Knowing our premium paid, we can calculate our potential max profit simply by taking the difference in our strike prices ($1850 – $1750), which in this case is $100, then we multiply $100 by $100 because this is a futures contract. That gives us a total of $10,000 as our max gross profit, minus our

January Silver Options Trade

If you prefer Silver, we are looking at a year-end strategy that involves buying 1 January Silver $19.00 call at 120 cents as our long call. We then simultaneously sell 1 January Silver $19.75 call at 95 cents as our short call. This action creates our premium, which is 25. We then multiply that by $50 to account for Silver's multiplier to get $1,250, or our total premium (plus any commissions or clearing fees).

Knowing our premium paid, we can calculate our potential max profit simply by taking the difference in our strike prices ($19.75 – $19.00), which in this case is 75 cents, then we multiply 75 by $50 because this is a futures contract. That gives us a total of $3,750 as our max gross profit, minus our $1,250 premium, leaving us with a max net profit of $2,500 (less any commissions or clearing fees). If you have never traded futures or commodities, I just completed a new educational guide that answers all your questions on transferring your current investing skills into trading "real assets," such as the 10 oz Gold futures contract. You can request yours here: Trade Metals, Transition your Experience Book.

By Phillip Streible

Contributing to kitco.comweek's low of $1,622.20. Wyckoff's Market Rating: 1.5.

December silver futures bears have the firm overall near-term technical advantage. Silver bulls' next upside price objective is closing prices above solid technical resistance at $20.00. The next downside price objective for the bears is closing prices below solid support at the September low of $17.40. First resistance is seen at this week's high of $19.045 and then at $19.40. Next support is seen at Tuesday's low of $18.295 and then at $18.00. Wyckoff's Market Rating: 2.5.

December N.Y. copper closed up 670 points at 342.55 cents today. Prices closed near the session high today. The copper bears have the overall near-term technical advantage. Prices are in a four-week-old downtrend on the daily bar chart. Copper bulls' next upside price objective is pushing and closing prices above solid technical resistance at the September high of 369.25 cents. The next downside price objective for the bears is closing prices below solid technical support at the July low of 315.55 cents. First resistance is seen at 350.00 cents and then at 355.00 cents. First support is seen at today's low of 330.55 cents and then at this week's low of 324.30 cents. Wyckoff's Market Rating: 2.5.

By Jim Wyckoff

For Kitco News

Time to buy Gold and Silver on the dips

Tim Moseley