
Gold, silver rally as Federal Reserve leans surprisingly easy
Gold and silver prices sharply up in midday U.S. trading Thursday, in the aftermath of surprisingly dovish rhetoric on U.S. monetary policy from the Federal Reserve. February gold was last up $56.50 at $2,054.00. March silver was last up $1.579 at $24.505. (Gold and silver futures prices had officially settled before the FOMC meeting concluded Wednesday afternoon. Thus, the big gains noted in today's prices.)
The marketplace got a dovish surprise from the Federal Reserve Wednesday. While the Federal Open Market Committee (FOMC) left interest rates unchanged, the committee and Fed Chairman Jerome Powell pivoted from their heretofore hawkish rhetoric of a tight monetary policy and toward loosening policy, including future interest rate cuts. The Fed's "dot plots" now indicate three interest rate cuts (totaling 0.75%) in 2024. Markets cheered the Fed news as the U.S. stock indexes hit new highs for the year, gold prices soared back above $2,000, the U.S. dollar index dropped sharply and Treasury yields declined. The benchmark 10-year note yield dropped below 4%. The now much-improved risk appetite in the general marketplace should work to support further gains in equities and commodity markets for at least the near term. A Barrons headline today reads: "Markets rejoice as Fed doves take flight…."
The Bank of England kept its monetary policy steady at its regular meeting Thursday, as expected. The European Central Bank also kept its policy steady, but ECB President Christine Lagarde still sounded a hawkish tone in her press conference.
A stronger-than-expected U.S. retail sales report this morning did not support the Fed's monetary-policy-easing rhetoric Wednesday afternoon, and that likely helped to push gold and silver prices down from their daily highs.
 Fed's Powell confirms FOMC believes terminal rate has been reached, says outlook reflects latest CPI and PPI data
U.S. stock index futures are firmer at midday and hit new contract highs and new highs for the year, when the New York day session begins. The Dow Jones Industrial Average set a record-high today.
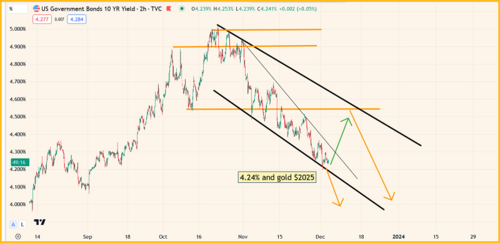
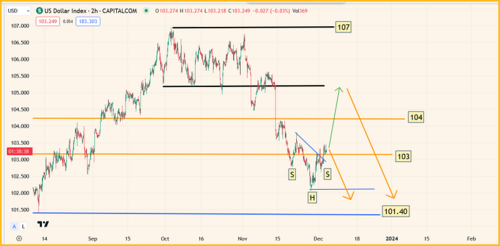
The key outside markets today see the U.S. dollar index sharply lower and hit a four-month low, on follow-through selling pressure from Wednesday's sharp losses. Nymex crude oil prices are solidly up and trading around $72.00 a barrel, after hitting a 5.5-month low Wednesday. The yield on the benchmark U.S. Treasury 10-year note is presently fetching 3.908%.

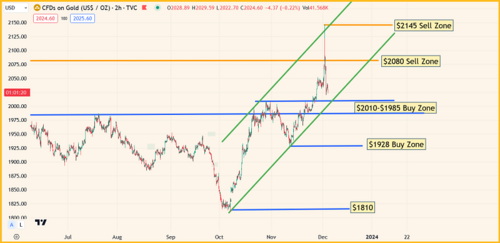
Technically, February gold futures prices Wednesday scored a bullish "outside day" up after hitting a three-week low early on. The bulls have the overall near-term technical advantage and have regained strength. Prices are in a nine-week-old uptrend on the daily bar chart. Bulls' next upside price objective is to produce a close above solid resistance at $2,100.00. Bears' next near-term downside price objective is pushing futures prices below solid technical support at $2,000.00. First resistance is seen at today's high of $2,062.90 and then at $2,072.70. First support is seen at today's low of $2,039.10 and then at $2,025.00. Wyckoff's Market Rating: 7.0
March silver futures prices Wednesday scored a big and bullish "outside day" up after hitting a three-week low early on today. The silver bulls have gained the overall near-term technical advantage and have regained power. Silver bulls' next upside price objective is closing prices above solid technical resistance at $26.00. The next downside price objective for the bears is closing prices below solid support at this week's low of $22.785. First resistance is seen at $24.75 and then at $25.00. Next support is seen at $24.00 and then at $23.75. Wyckoff's Market Rating: 6.0.
March N.Y. copper closed up 1,060 points at 389.35 cents today. Prices closed nearer the session high today. The copper bulls have the overall near-term technical advantage and gained power today. Prices are in a choppy, seven-week-old uptrend on the daily bar chart. Copper bulls' next upside price objective is pushing and closing prices above solid technical resistance at the July high of 404.45 cents. The next downside price objective for the bears is closing prices below solid technical support at the December low of 372.90 cents. First resistance is seen at today's high of 390.95 cents and then at the December high of 393.30 cents. First support is seen at 385.00 cents and then at today's low of 382.70 cents. Wyckoff's Market Rating: 6.5..
By
Jim Wyckoff
For Kitco News
Tim Moseley

 Gold to outperform silver and platinum as weak growth forces the Fed to cut rates in 2024 – Heraeus

 Gold is poised for new all-time highs in 2024 – World Gold Council


 According to some analysts, next week will be an important test for the gold market as a hawkish Fed could put downward pressure on a market that is already sensitive following Monday's blow-off top.

 Is Argentina's new anti-central bank stance triggering a new trend? – Cory Klippsten

 Spot gold opened the Sunday evening session with massive momentum, obliterating key resistance levels and the previous high to set a new all-time high of $2,148.99 within the first half-hour of trading.
 Gold prices to see a sustained push above $2,100 in 2024 – TD Securities